Research Notes
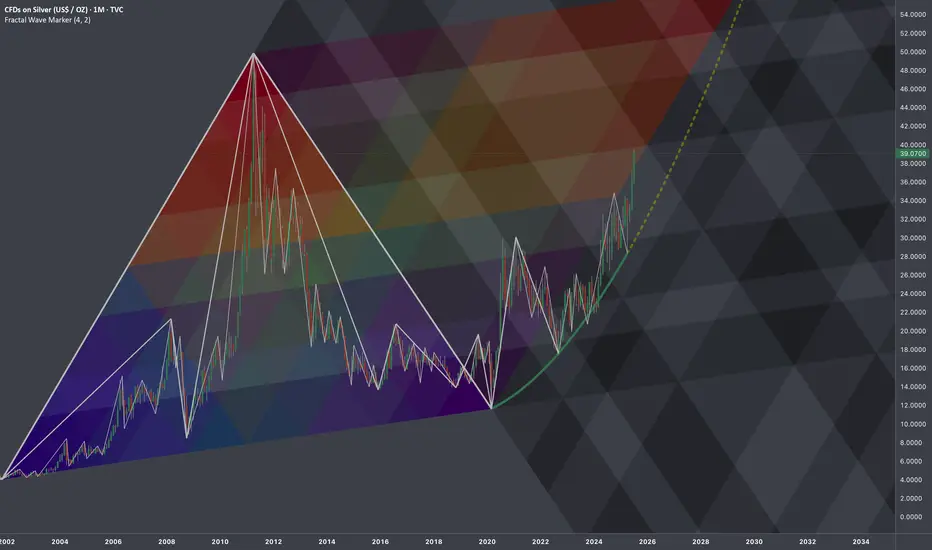
Working out probabilistic texture using multiple fibonacci channels on just 3 coordinates of fractal cycle (late 2001 - 2020) on linear scale (on log chart it would still be relevant, so you can switch to view with right click on price scale for selection).
I'd look for patterns of bullish exhaustion only after price crosses the curve.
Working out probabilistic texture using multiple fibonacci channels on just 3 coordinates of fractal cycle (late 2001 - 2020) on linear scale (on log chart it would still be relevant, so you can switch to view with right click on price scale for selection).
- To describe behavior of price and key levels on smaller scale starting from covid we'll use
L-H-L: - Using coordinates to express surface area of broken cycle with fibs mimicking rise, fall and side mapping cycle:
I'd look for patterns of bullish exhaustion only after price crosses the curve.
Unlock exclusive tools: fractlab.com
ᴀʟʟ ᴄᴏɴᴛᴇɴᴛ ᴘʀᴏᴠɪᴅᴇᴅ ʙʏ ꜰʀᴀᴄᴛʟᴀʙ ɪꜱ ɪɴᴛᴇɴᴅᴇᴅ ꜰᴏʀ ɪɴꜰᴏʀᴍᴀᴛɪᴏɴᴀʟ ᴀɴᴅ ᴇᴅᴜᴄᴀᴛɪᴏɴᴀʟ ᴘᴜʀᴘᴏꜱᴇꜱ ᴏɴʟʏ.
ᴘᴀꜱᴛ ᴘᴇʀꜰᴏʀᴍᴀɴᴄᴇ ɪꜱ ɴᴏᴛ ɪɴᴅɪᴄᴀᴛɪᴠᴇ ᴏꜰ ꜰᴜᴛᴜʀᴇ ʀᴇꜱᴜʟᴛꜱ.
ᴀʟʟ ᴄᴏɴᴛᴇɴᴛ ᴘʀᴏᴠɪᴅᴇᴅ ʙʏ ꜰʀᴀᴄᴛʟᴀʙ ɪꜱ ɪɴᴛᴇɴᴅᴇᴅ ꜰᴏʀ ɪɴꜰᴏʀᴍᴀᴛɪᴏɴᴀʟ ᴀɴᴅ ᴇᴅᴜᴄᴀᴛɪᴏɴᴀʟ ᴘᴜʀᴘᴏꜱᴇꜱ ᴏɴʟʏ.
ᴘᴀꜱᴛ ᴘᴇʀꜰᴏʀᴍᴀɴᴄᴇ ɪꜱ ɴᴏᴛ ɪɴᴅɪᴄᴀᴛɪᴠᴇ ᴏꜰ ꜰᴜᴛᴜʀᴇ ʀᴇꜱᴜʟᴛꜱ.
כתב ויתור
המידע והפרסומים אינם אמורים להיות, ואינם מהווים, עצות פיננסיות, השקעות, מסחר או סוגים אחרים של עצות או המלצות שסופקו או מאושרים על ידי TradingView. קרא עוד בתנאים וההגבלות.