📜 Summary
Despite some recent volatile price action, Silver is positioning for a potential bullish continuation. The current setup suggests that the price is undergoing a healthy retracement within a larger uptrend, presenting an attractive entry point for a long position, aiming for new highs.
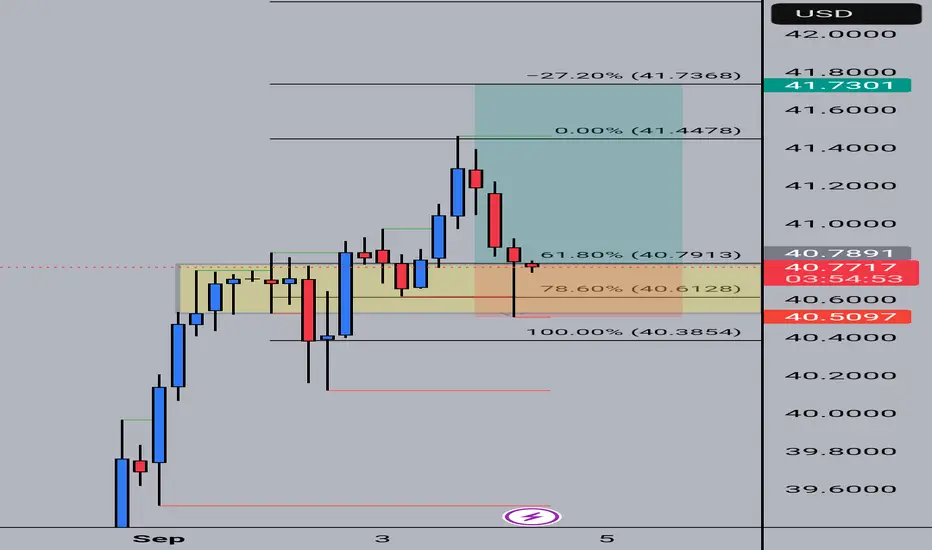
📊 4-Hour Chart (H4) Analysis
The 4-hour chart provides a clear view of the recent price action and the proposed bullish setup.
📈 The Bullish Impulse: The chart clearly shows a strong upward impulse wave that began at the start of September, pushing the price from below $39.00 to a high near $41.50. This indicates strong buying interest in the market.
Fibonacci Retracement: A Fibonacci tool is expertly drawn on this most recent upward leg, identifying key support zones. The price has retraced into the 61.8% (40.7913) and 78.6% (40.6128) retracement levels. These are classic areas where smart money looks for entries to join the existing trend.
Potential Reversal Point: The price action around these Fibonacci levels suggests that this could be a temporary pullback, forming a solid base for the next leg higher. We are anticipating a bounce from this zone.
💡 Trading Scenario: Long Position
The chart illustrates a potential long (buy) trade based on the expectation of a bounce and continuation of the bullish trend.
🔮 Scenario: Bullish - The retracement to key Fibonacci levels is seen as an opportunity for the uptrend to resume.
▶️ Entry: Around $40.78. This entry point is strategically placed within the strong Fibonacci retracement zone, aiming to capture the bounce.
🛡️ Stop-Loss: Placed at $40.50. This stop-loss is positioned below the 78.6% Fibonacci level and a recent swing low, providing protection if the price dips further than expected.
💰 Take Profit: The target is set significantly higher at $41.70. This target aims for a break above the previous high ($41.50) and seeks to capture a substantial continuation of the bullish move. This level aligns with a -27.20% Fibonacci extension, which is a common target for the next impulse wave.
✅ Key Considerations for this Bullish Setup
Trend Following: This setup is based on the principle of trend following, looking for pullbacks in an established uptrend.
Fibonacci Confluence: The entry point is supported by the confluence of major Fibonacci retracement levels.
Risk/Reward: The setup aims for a favorable risk/reward ratio, targeting a move significantly higher than the stop-loss distance.
Disclaimer: This analysis is for educational purposes only and should not be considered financial advice. Trading involves risks. Always conduct your own research and manage your risk effectively before placing a trade.
Despite some recent volatile price action, Silver is positioning for a potential bullish continuation. The current setup suggests that the price is undergoing a healthy retracement within a larger uptrend, presenting an attractive entry point for a long position, aiming for new highs.
📊 4-Hour Chart (H4) Analysis
The 4-hour chart provides a clear view of the recent price action and the proposed bullish setup.
📈 The Bullish Impulse: The chart clearly shows a strong upward impulse wave that began at the start of September, pushing the price from below $39.00 to a high near $41.50. This indicates strong buying interest in the market.
Fibonacci Retracement: A Fibonacci tool is expertly drawn on this most recent upward leg, identifying key support zones. The price has retraced into the 61.8% (40.7913) and 78.6% (40.6128) retracement levels. These are classic areas where smart money looks for entries to join the existing trend.
Potential Reversal Point: The price action around these Fibonacci levels suggests that this could be a temporary pullback, forming a solid base for the next leg higher. We are anticipating a bounce from this zone.
💡 Trading Scenario: Long Position
The chart illustrates a potential long (buy) trade based on the expectation of a bounce and continuation of the bullish trend.
🔮 Scenario: Bullish - The retracement to key Fibonacci levels is seen as an opportunity for the uptrend to resume.
▶️ Entry: Around $40.78. This entry point is strategically placed within the strong Fibonacci retracement zone, aiming to capture the bounce.
🛡️ Stop-Loss: Placed at $40.50. This stop-loss is positioned below the 78.6% Fibonacci level and a recent swing low, providing protection if the price dips further than expected.
💰 Take Profit: The target is set significantly higher at $41.70. This target aims for a break above the previous high ($41.50) and seeks to capture a substantial continuation of the bullish move. This level aligns with a -27.20% Fibonacci extension, which is a common target for the next impulse wave.
✅ Key Considerations for this Bullish Setup
Trend Following: This setup is based on the principle of trend following, looking for pullbacks in an established uptrend.
Fibonacci Confluence: The entry point is supported by the confluence of major Fibonacci retracement levels.
Risk/Reward: The setup aims for a favorable risk/reward ratio, targeting a move significantly higher than the stop-loss distance.
Disclaimer: This analysis is for educational purposes only and should not be considered financial advice. Trading involves risks. Always conduct your own research and manage your risk effectively before placing a trade.
כתב ויתור
המידע והפרסומים אינם אמורים להיות, ואינם מהווים, עצות פיננסיות, השקעות, מסחר או סוגים אחרים של עצות או המלצות שסופקו או מאושרים על ידי TradingView. קרא עוד בתנאים וההגבלות.
כתב ויתור
המידע והפרסומים אינם אמורים להיות, ואינם מהווים, עצות פיננסיות, השקעות, מסחר או סוגים אחרים של עצות או המלצות שסופקו או מאושרים על ידי TradingView. קרא עוד בתנאים וההגבלות.