SNX rank: 192
SNX coin previously showed strong movements and was at the center of hype, with a significant rise from the bottom to the top.
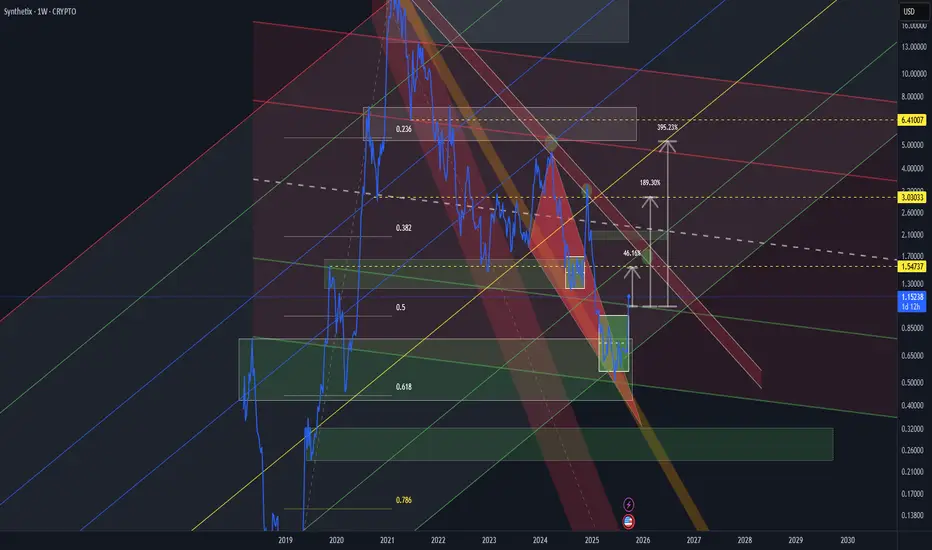
If we stretch the Fibonacci retracement from the low to the high, we can see that the price came to the golden level 0.618, where the new accumulation zone started.
Typically, major players start accumulating positions in the 0.3–0.5 zone, then activity intensifies around 0.5–0.618, and they usually don’t go beyond 0.786.
However, safer entry levels are usually below 0.618.
The chart shows two channels:
Global channel — marked with multicolored lines.
Descending channel — red and green lines, where:
Red — selling zones;
Green — accumulation zones.
Additionally, I’ve added a channel drawn from the top through two key points, from which corrections occurred. This allows us to identify a potential strong bounce zone at $1.54. This is the same level where the previous accumulation took place before the sharp rise and where there was an intermediate high in December.
Further movement will depend on how the price reacts to the 0.618 zone and the retention of key levels.
SNX coin previously showed strong movements and was at the center of hype, with a significant rise from the bottom to the top.
If we stretch the Fibonacci retracement from the low to the high, we can see that the price came to the golden level 0.618, where the new accumulation zone started.
Typically, major players start accumulating positions in the 0.3–0.5 zone, then activity intensifies around 0.5–0.618, and they usually don’t go beyond 0.786.
However, safer entry levels are usually below 0.618.
The chart shows two channels:
Global channel — marked with multicolored lines.
Descending channel — red and green lines, where:
Red — selling zones;
Green — accumulation zones.
Additionally, I’ve added a channel drawn from the top through two key points, from which corrections occurred. This allows us to identify a potential strong bounce zone at $1.54. This is the same level where the previous accumulation took place before the sharp rise and where there was an intermediate high in December.
Further movement will depend on how the price reacts to the 0.618 zone and the retention of key levels.
פרסומים קשורים
כתב ויתור
המידע והפרסומים אינם מיועדים להיות, ואינם מהווים, ייעוץ או המלצה פיננסית, השקעתית, מסחרית או מכל סוג אחר המסופקת או מאושרת על ידי TradingView. קרא עוד ב־תנאי השימוש.
פרסומים קשורים
כתב ויתור
המידע והפרסומים אינם מיועדים להיות, ואינם מהווים, ייעוץ או המלצה פיננסית, השקעתית, מסחרית או מכל סוג אחר המסופקת או מאושרת על ידי TradingView. קרא עוד ב־תנאי השימוש.