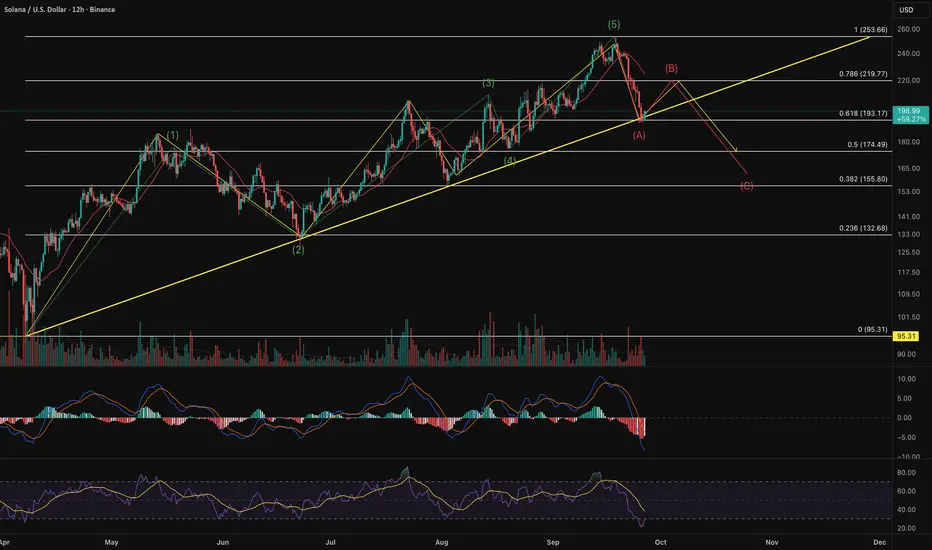
Wave B usually retraces 38‑62 % of wave A. A 38.2 % retracement from the wave‑A low (≈ US$193.17) yields a bounce to roughly US$216.28, while a 61.8 % retracement projects a rally toward US$230.55. The earlier peak around US$219.77 (78.6 % fib of the full range) provides a realistic target range (≈ US$216–231).
In zigzag corrections, wave C often equals wave A in length or extends by a Fibonacci multiple. Assuming wave B tops near US$219.77–230.55, a drop equal to the US$60.49 length of wave A would target US$159–170. The 38.2 % Fibonacci retracement of the entire move (≈ US$155.80) and the 50 % level (≈ US$174.49) mark likely support zones.
(generated by AI)
*All chart ideas references an opinion and is for information and entertainment purposes only. It is not intended to be investment advice.
*所有图表创意均参考观点,仅供参考和娱乐目的。 它不作为投资建议。
*所有图表创意均参考观点,仅供参考和娱乐目的。 它不作为投资建议。
כתב ויתור
המידע והפרסומים אינם אמורים להיות, ואינם מהווים, עצות פיננסיות, השקעות, מסחר או סוגים אחרים של עצות או המלצות שסופקו או מאושרים על ידי TradingView. קרא עוד בתנאים וההגבלות.
