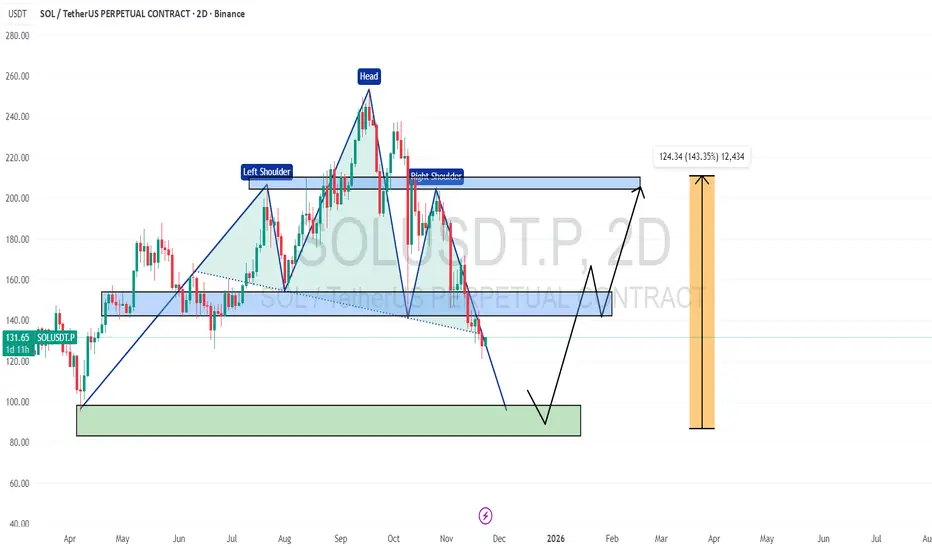
📌 SOL 2D Chart shows a head & shoulder pattern✅
📌 If this continues, the price may continue to decline ✅
📌 However, a bullish reversal is expected from the support zone below ✅
If this happens, the price may go back to the $150, $200+ range 🔥🚀
📌 If this continues, the price may continue to decline ✅
📌 However, a bullish reversal is expected from the support zone below ✅
If this happens, the price may go back to the $150, $200+ range 🔥🚀
Join My Free Signal Channel ➡ t.me/Leo524
כתב ויתור
המידע והפרסומים אינם מיועדים להיות, ואינם מהווים, ייעוץ או המלצה פיננסית, השקעתית, מסחרית או מכל סוג אחר המסופקת או מאושרת על ידי TradingView. קרא עוד ב־תנאי השימוש.
Join My Free Signal Channel ➡ t.me/Leo524
כתב ויתור
המידע והפרסומים אינם מיועדים להיות, ואינם מהווים, ייעוץ או המלצה פיננסית, השקעתית, מסחרית או מכל סוג אחר המסופקת או מאושרת על ידי TradingView. קרא עוד ב־תנאי השימוש.