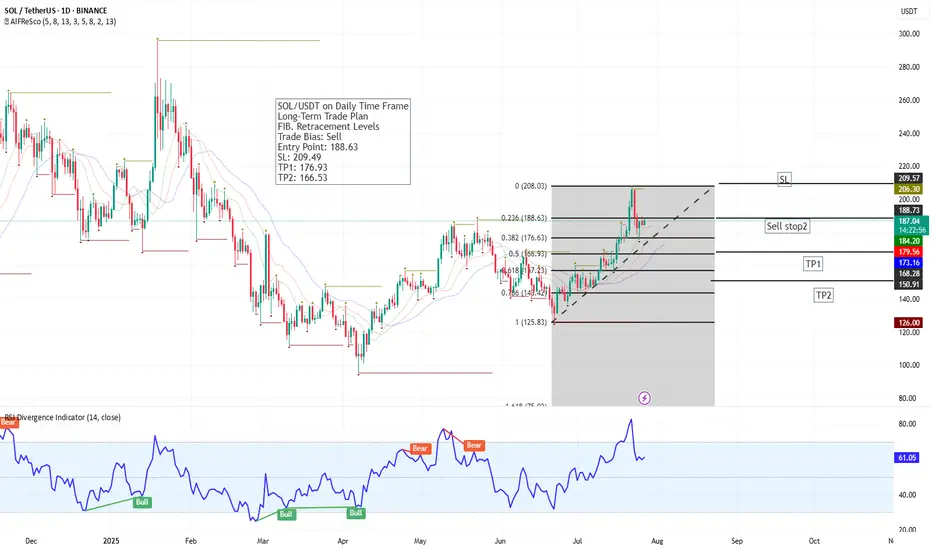
SOL has completed a strong bullish leg and is now reacting from the 0.236 Fibonacci retracement level at 188.63. A sell setup is developing based on this resistance zone and weakening momentum.
🔻 Trade Plan:
Sell Stop: 188.63
SL: 209.49
TP1: 176.93 (38.2% Fib)
TP2: 166.53 (50% Fib)
📉 RSI at 61.02 shows early signs of a bearish divergence. If price loses momentum at current levels, this setup could offer a solid retracement trade toward the mid-Fibonacci levels.
Watch for breakdown confirmation and manage risk accordingly.
כתב ויתור
המידע והפרסומים אינם אמורים להיות, ואינם מהווים, עצות פיננסיות, השקעות, מסחר או סוגים אחרים של עצות או המלצות שסופקו או מאושרים על ידי TradingView. קרא עוד בתנאים וההגבלות.
כתב ויתור
המידע והפרסומים אינם אמורים להיות, ואינם מהווים, עצות פיננסיות, השקעות, מסחר או סוגים אחרים של עצות או המלצות שסופקו או מאושרים על ידי TradingView. קרא עוד בתנאים וההגבלות.