#SOLANA Weekly Chart Breakdown – 2020 Fractal Signals Massive Rally Ahead!
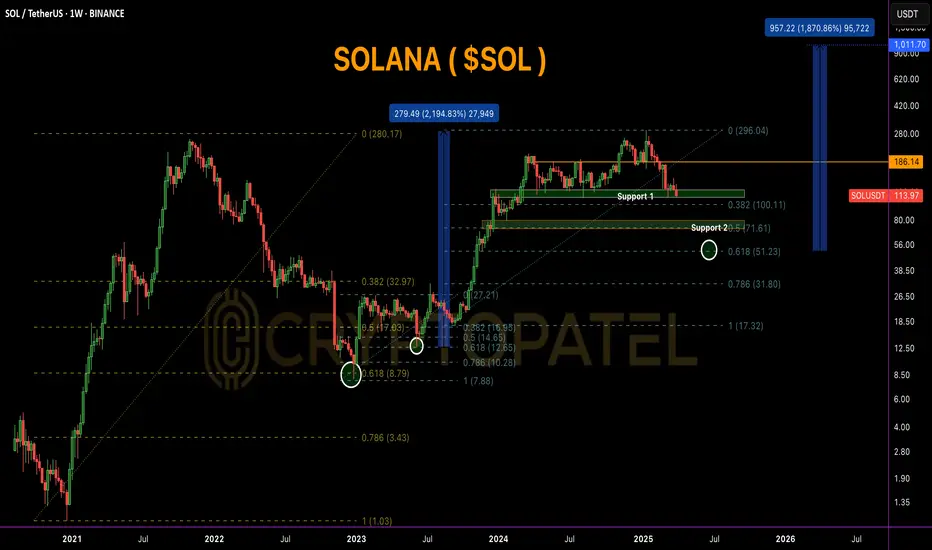
 SOL is trading at $114.35, currently sitting on a key Fibonacci 0.382 support zone ($100–$115). This area has historically acted as a strong bounce level and is perfect for early accumulation.
If this zone fails, the next major support is the golden pocket ($50–$72) — also marked as Support 2, aligning with the 0.618 Fib retracement.
Historically, this level triggered a 2,100% rally back in 2020-21. If this fractal pattern repeats, we could be looking at a future target near $1,000+.
Breakout level to watch:
▪️ $186 = Bullish confirmation
▪️ $296 = Previous ATH
▪️ $1,011 = Fibonacci-based bull cycle target
Accumulation Plan:
▪️ Zone 1: $100–$115 → Light spot entries
▪️ Zone 2: $50–$72 → Heavy long-term accumulation
✅ Holding above $100 keeps the bullish structure intact.
✅ Break above $186 = start of the next bull wave.
Smart accumulation now can lead to 10x+ returns in the upcoming cycle!
It's All About SO/USDT Overview.
Twitter: twitter.com/CryptoPatel
Telegram: t.me/OfficialCryptoPatel
Instagram: instagram.com/cryptopatel?utm_medium=copy_link
Telegram: t.me/OfficialCryptoPatel
Instagram: instagram.com/cryptopatel?utm_medium=copy_link
כתב ויתור
המידע והפרסומים אינם מיועדים להיות, ואינם מהווים, ייעוץ או המלצה פיננסית, השקעתית, מסחרית או מכל סוג אחר המסופקת או מאושרת על ידי TradingView. קרא עוד ב־תנאי השימוש.