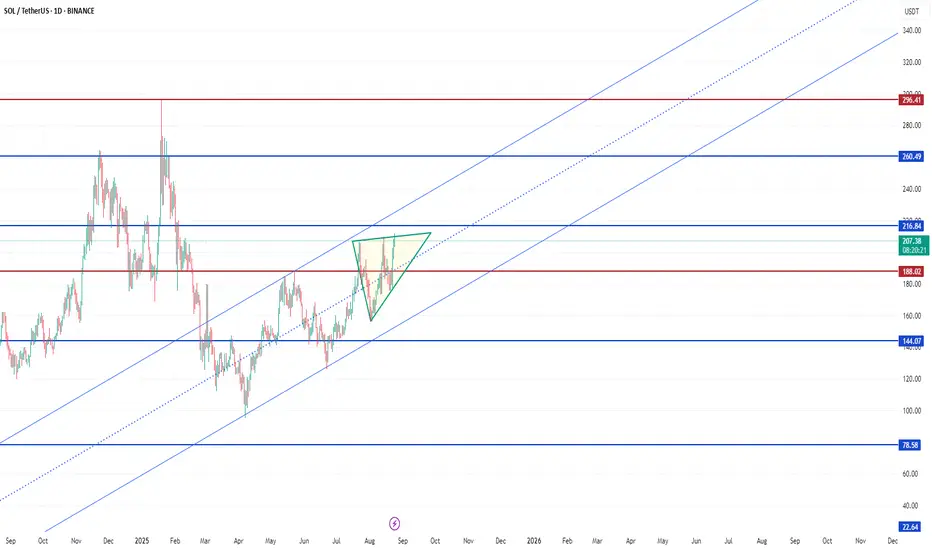
The bar chart is in a mid-upward trend, having started in April 2025 and continued up to the present. Now, the chart is trapped in a triangle for a month. The future trend of the chart depends on the following break. If it can break above the triangle, and respectively exceed the resistance level, at $217, it would increase by $216 in the mid term.
On the other hand, the opposite scenario is a break below. In other words, the price might reduce to $144 if it breaks the support level, at $188, it is a crucial level because of the juncture of the bottom of the triangle, and $188 support level.
To sum up, there are two ways, an increase or a decrease, for SOLANA, and it generally depends on the first break will occur up or down.
כתב ויתור
המידע והפרסומים אינם מיועדים להיות, ואינם מהווים, ייעוץ או המלצה פיננסית, השקעתית, מסחרית או מכל סוג אחר המסופקת או מאושרת על ידי TradingView. קרא עוד ב־תנאי השימוש.
כתב ויתור
המידע והפרסומים אינם מיועדים להיות, ואינם מהווים, ייעוץ או המלצה פיננסית, השקעתית, מסחרית או מכל סוג אחר המסופקת או מאושרת על ידי TradingView. קרא עוד ב־תנאי השימוש.