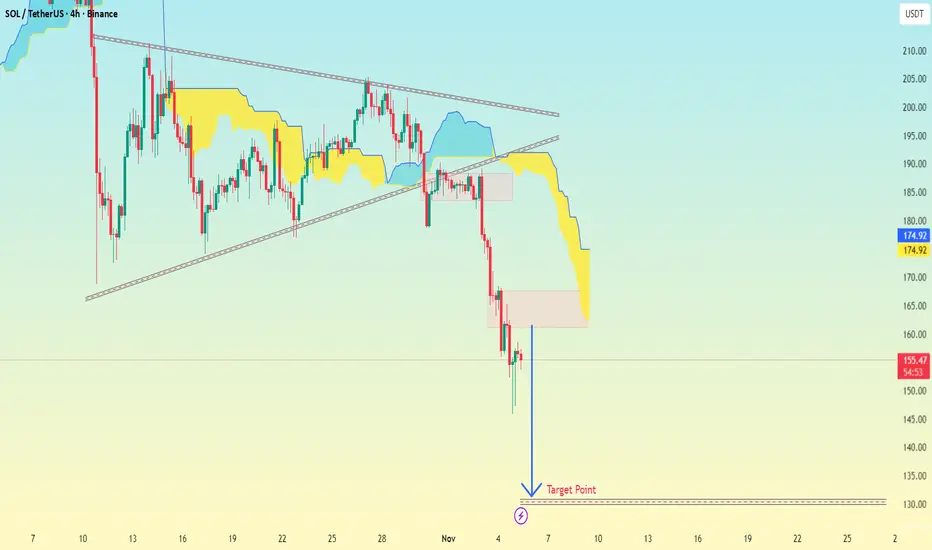
SOL/USDT (Solana vs Tether)
Timeframe: 4-hour chart
Exchange: Binance
Analysis tool: Ichimoku Cloud + trendlines
Pattern: my drawn a descending triangle or bearish pennant that recently broke downwards.
Current Price: Around $153.67
Target Point (marked): Around $135 – $137 zone
🎯 Target Zone
From my chart, the “Target Point” label is placed approximately at:
> $135 USDT
This aligns with a measured move projection from the height of the triangle (around $200 down to ~$160), giving a target near $135 — a typical price objective for a bearish breakout.
🧠 Quick Breakdown:
Price broke below support near $160.
The Ichimoku Cloud turned bearish (price below cloud, red span ahead).
Momentum and volume confirm downside continuation.
Target completion likely around $135 – $137, unless support appears earlier.
עסקה פעילה
active📲 Join telegram channel free .
t.me/addlist/dg3uSwzkMSplNjFk
Forex, Gold & Crypto Signals with detailed analysis & get consistent results.
t.me/addlist/dg3uSwzkMSplNjFk
Gold Signal's with proper TP & SL for high profit opportunities.
t.me/addlist/dg3uSwzkMSplNjFk
Forex, Gold & Crypto Signals with detailed analysis & get consistent results.
t.me/addlist/dg3uSwzkMSplNjFk
Gold Signal's with proper TP & SL for high profit opportunities.
פרסומים קשורים
כתב ויתור
המידע והפרסומים אינם אמורים להיות, ואינם מהווים, עצות פיננסיות, השקעות, מסחר או סוגים אחרים של עצות או המלצות שסופקו או מאושרים על ידי TradingView. קרא עוד בתנאים וההגבלות.
📲 Join telegram channel free .
t.me/addlist/dg3uSwzkMSplNjFk
Forex, Gold & Crypto Signals with detailed analysis & get consistent results.
t.me/addlist/dg3uSwzkMSplNjFk
Gold Signal's with proper TP & SL for high profit opportunities.
t.me/addlist/dg3uSwzkMSplNjFk
Forex, Gold & Crypto Signals with detailed analysis & get consistent results.
t.me/addlist/dg3uSwzkMSplNjFk
Gold Signal's with proper TP & SL for high profit opportunities.
פרסומים קשורים
כתב ויתור
המידע והפרסומים אינם אמורים להיות, ואינם מהווים, עצות פיננסיות, השקעות, מסחר או סוגים אחרים של עצות או המלצות שסופקו או מאושרים על ידי TradingView. קרא עוד בתנאים וההגבלות.