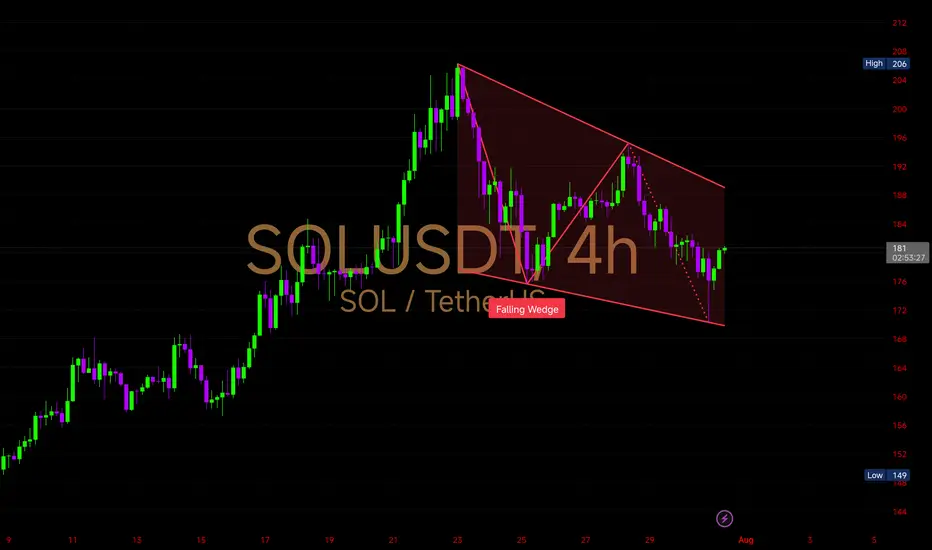
• Falling Wedge, sloping downward with converging trendlines
• Price has respected both upper and lower bounds of the wedge with multiple touches
• SOLANA corrected from a high of $206 down to the wedge’s base near $174-$176
Latest candle shows buying pressure at the wedge support, hinting at a potential bounce
Support Zone: $174 → $176 (bottom of the wedge)
Resistance to Watch: $184 (upper wedge line), followed by breakout level at $188
Breakout Confirmation: Clean close above $188 on solid volume
📈 Probable Scenarios:
Bullish: Breakout from the wedge could lead to a move back toward $195-$200
Bearish: Rejection at upper wedge line could push price back to test $174 again
Wedge formations after extended rallies often act as bullish continuation patterns. If momentum picks up,
כתב ויתור
המידע והפרסומים אינם מיועדים להיות, ואינם מהווים, ייעוץ או המלצה פיננסית, השקעתית, מסחרית או מכל סוג אחר המסופקת או מאושרת על ידי TradingView. קרא עוד ב־תנאי השימוש.
כתב ויתור
המידע והפרסומים אינם מיועדים להיות, ואינם מהווים, ייעוץ או המלצה פיננסית, השקעתית, מסחרית או מכל סוג אחר המסופקת או מאושרת על ידי TradingView. קרא עוד ב־תנאי השימוש.