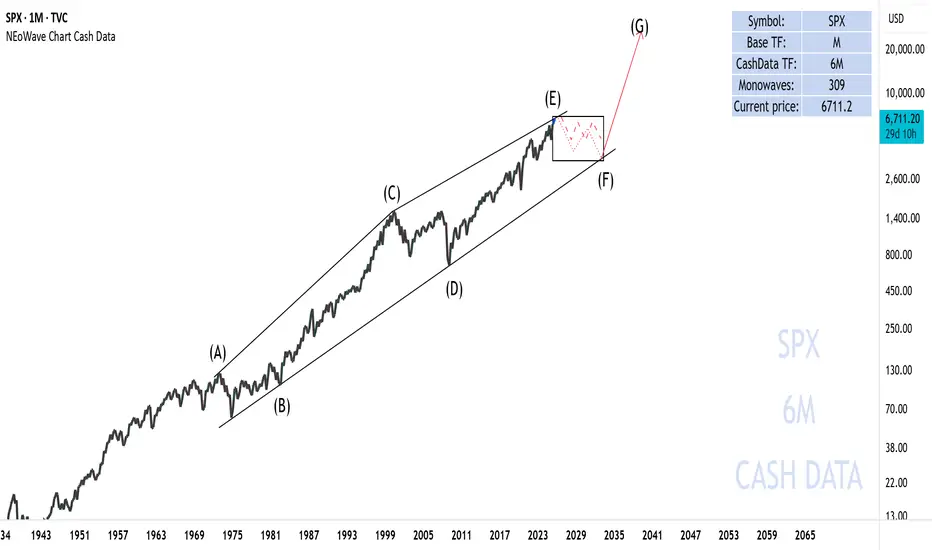
In my view, the S&P 500 index is forming a diametric pattern in the long-term timeframe, with wave (E) currently nearing completion. Following this, the index is expected to enter a corrective phase, which could involve both price and time corrections:
- The price correction may extend to the range of the drawn box, potentially dropping the index to 3,500 points.
- Alternatively, the price could decline to the 4,700–4,800 range and then consolidate over time to complete the time correction.
Good luck
NEoWave Chart
כתב ויתור
המידע והפרסומים אינם אמורים להיות, ואינם מהווים, עצות פיננסיות, השקעות, מסחר או סוגים אחרים של עצות או המלצות שסופקו או מאושרים על ידי TradingView. קרא עוד בתנאים וההגבלות.
כתב ויתור
המידע והפרסומים אינם אמורים להיות, ואינם מהווים, עצות פיננסיות, השקעות, מסחר או סוגים אחרים של עצות או המלצות שסופקו או מאושרים על ידי TradingView. קרא עוד בתנאים וההגבלות.