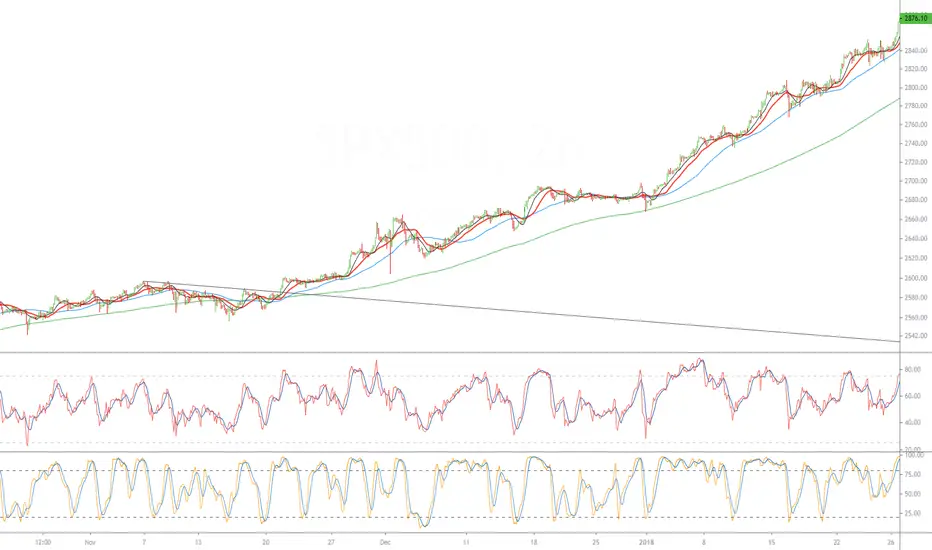
are always important later. click the "add more candles" blue arrow
הערה
if it populates after publishing and provides oneהערה
it didnt give me the blue arrow, but you can click and drag the chart to the left to show future candles and see the result. the point is to watch for these kinds of break outs (you can see how important that break out was by how far it went) and keep the line on your chart or be able to pick out the break out later and draw it in.הערה
and if you think that is crazy, extend the same line to christmas 2018.כתב ויתור
המידע והפרסומים אינם מיועדים להיות, ואינם מהווים, ייעוץ או המלצה פיננסית, השקעתית, מסחרית או מכל סוג אחר המסופקת או מאושרת על ידי TradingView. קרא עוד ב־תנאי השימוש.
כתב ויתור
המידע והפרסומים אינם מיועדים להיות, ואינם מהווים, ייעוץ או המלצה פיננסית, השקעתית, מסחרית או מכל סוג אחר המסופקת או מאושרת על ידי TradingView. קרא עוד ב־תנאי השימוש.