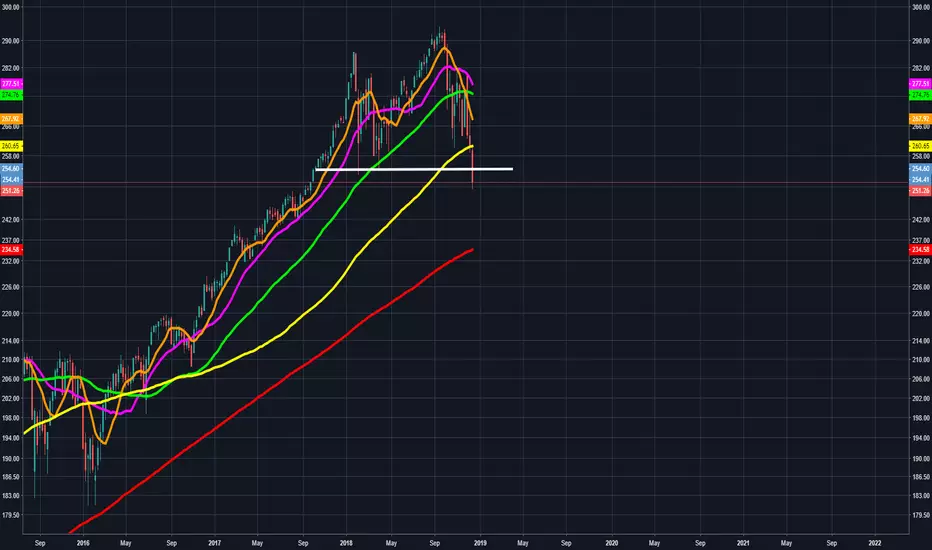
SPY just broke the 100 weekly moving average and has broken below a previous support level as shown by the white line around 254-255 that had held the price back in February and April. I suspect it will retest the 200 weekly MA around 234-235 which is approximately a 6-7% drop. If the 200 weekly MA does not hold, we could be setting up for a longer-term recession as we enter into 2019.
Moving average guide (all weekly for this chart):
10 MA in orange
20 MA in pink
50 MA in green
100 MA in yellow
200 MA in red.
Moving average guide (all weekly for this chart):
10 MA in orange
20 MA in pink
50 MA in green
100 MA in yellow
200 MA in red.
הערה
Coming down as expected: הערה
Getting closer: עסקה סגורה: היעד הושג
Target hit around 234-235: FTX US: ftx.us/
Sign up for Binance US here: binance.us/?ref=35000668
Sign up for Binance US here: binance.us/?ref=35000668
כתב ויתור
המידע והפרסומים אינם אמורים להיות, ואינם מהווים, עצות פיננסיות, השקעות, מסחר או סוגים אחרים של עצות או המלצות שסופקו או מאושרים על ידי TradingView. קרא עוד בתנאים וההגבלות.
FTX US: ftx.us/
Sign up for Binance US here: binance.us/?ref=35000668
Sign up for Binance US here: binance.us/?ref=35000668
כתב ויתור
המידע והפרסומים אינם אמורים להיות, ואינם מהווים, עצות פיננסיות, השקעות, מסחר או סוגים אחרים של עצות או המלצות שסופקו או מאושרים על ידי TradingView. קרא עוד בתנאים וההגבלות.