Has the S&P 500 Found a Support Area?
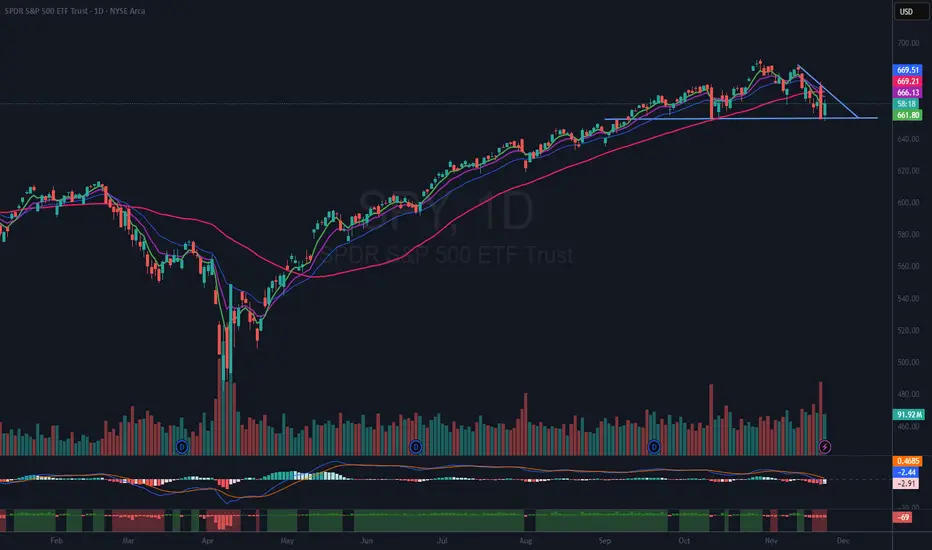
I have closely examined the SPY chart to determine whether the recent correction of 5% plus has reached a bottom. While the answer is uncertain, the chart suggests that the index dropped to a level of interest and subsequently bounced today. However, it remains unclear if today’s bounce signals a true reversal or is simply a temporary movement.
Criteria for Increasing Risk Exposure
To consider re-entering a larger position in the SPY ETF, which I previously trimmed after the price fell below the red 50-day moving average (DMA), I am looking for two critical signals. First, the price must recover the 50 DMA. Second, it needs to break above the downward-sloping trendline. Only if both conditions are met would I contemplate increasing my risk exposure.
Current Approach
At this stage, I am focused solely on observing present conditions and potential future developments. I am refraining from taking further action until clearer signals emerge from the chart.
I have closely examined the
Criteria for Increasing Risk Exposure
To consider re-entering a larger position in the SPY ETF, which I previously trimmed after the price fell below the red 50-day moving average (DMA), I am looking for two critical signals. First, the price must recover the 50 DMA. Second, it needs to break above the downward-sloping trendline. Only if both conditions are met would I contemplate increasing my risk exposure.
Current Approach
At this stage, I am focused solely on observing present conditions and potential future developments. I am refraining from taking further action until clearer signals emerge from the chart.
Ideas I publish are my own. They are not meant to be investment / trading advice. You are encouraged to do your own due diligence.
I am under no obligation to post any action or update to any idea.
Follow me on "X" where I post more content.
I am under no obligation to post any action or update to any idea.
Follow me on "X" where I post more content.
כתב ויתור
המידע והפרסומים אינם מיועדים להיות, ואינם מהווים, ייעוץ או המלצה פיננסית, השקעתית, מסחרית או מכל סוג אחר המסופקת או מאושרת על ידי TradingView. קרא עוד ב־תנאי השימוש.