📈 1-Week Performance
Over the past week, the stock has appreciated by 1.51%
📊 Key Metrics
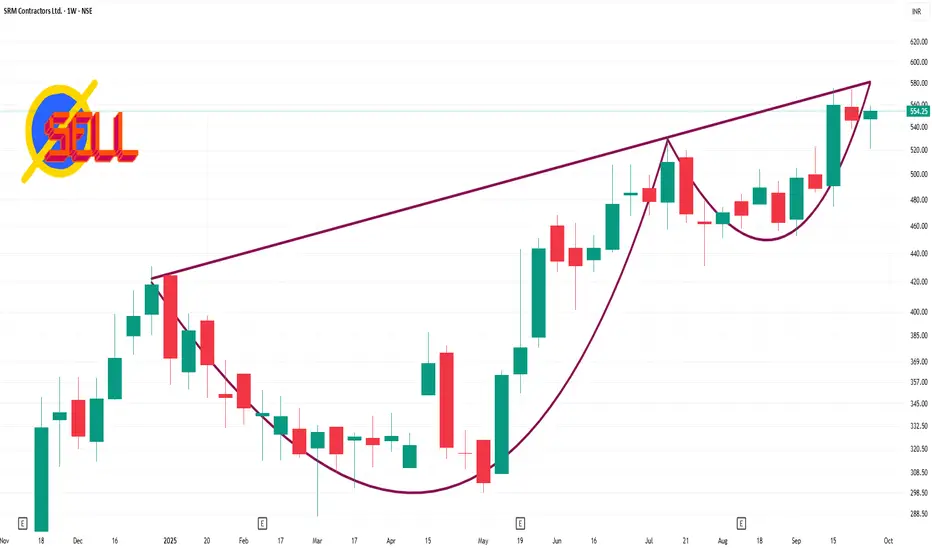
52-Week High: ₹575.20
52-Week Low: ₹246.00
Market Cap: Approximately ₹1,272 crore
P/E Ratio: 19.63
P/B Ratio: 4.5
The stock is currently trading above its 50-day and 200-day Simple Moving Averages, indicating a bullish trend.
🔍 Technical Outlook
The stock's current price above both the 50-day and 200-day SMAs indicates a bullish trend. The RSI suggests that the stock is in a neutral zone, neither overbought nor oversold, which could imply room for further upside. However, investors should monitor for any signs of overbought conditions or significant resistance levels near the 52-week high of ₹575.20.
Over the past week, the stock has appreciated by 1.51%
📊 Key Metrics
52-Week High: ₹575.20
52-Week Low: ₹246.00
Market Cap: Approximately ₹1,272 crore
P/E Ratio: 19.63
P/B Ratio: 4.5
The stock is currently trading above its 50-day and 200-day Simple Moving Averages, indicating a bullish trend.
🔍 Technical Outlook
The stock's current price above both the 50-day and 200-day SMAs indicates a bullish trend. The RSI suggests that the stock is in a neutral zone, neither overbought nor oversold, which could imply room for further upside. However, investors should monitor for any signs of overbought conditions or significant resistance levels near the 52-week high of ₹575.20.
פרסומים קשורים
כתב ויתור
המידע והפרסומים אינם מיועדים להיות, ואינם מהווים, ייעוץ או המלצה פיננסית, השקעתית, מסחרית או מכל סוג אחר המסופקת או מאושרת על ידי TradingView. קרא עוד ב־תנאי השימוש.
פרסומים קשורים
כתב ויתור
המידע והפרסומים אינם מיועדים להיות, ואינם מהווים, ייעוץ או המלצה פיננסית, השקעתית, מסחרית או מכל סוג אחר המסופקת או מאושרת על ידי TradingView. קרא עוד ב־תנאי השימוש.