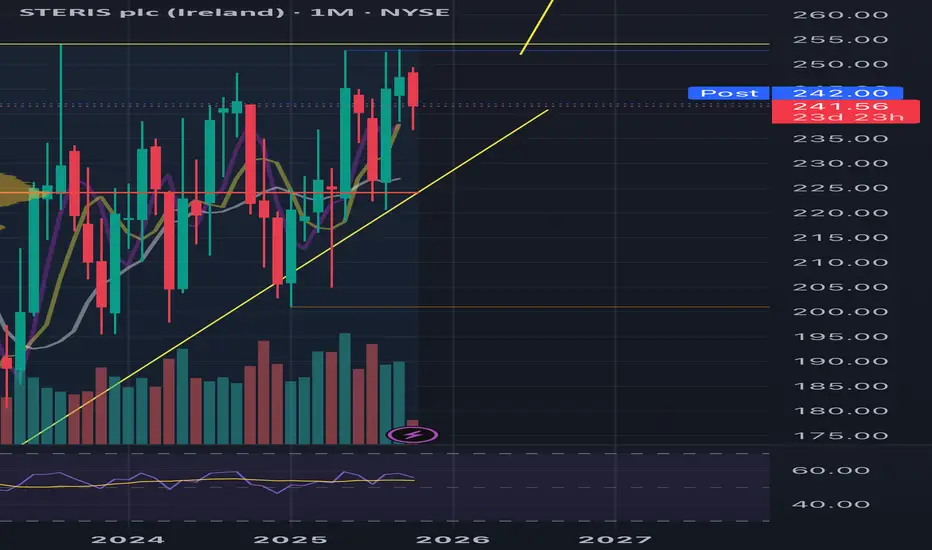
"STERIS plc (STE) monthly chart shows a classic bullish setup: after a strong long-term rally, the stock formed an ascending triangle pattern with rising lows and a strong resistance above. If  STE breaks out above resistance, the theoretical target—projecting the height of the pattern from the breakout zone—would be in the 335-350 range. Pattern confirmation and volume are key for trend continuation.
כתב ויתור
המידע והפרסומים אינם אמורים להיות, ואינם מהווים, עצות פיננסיות, השקעות, מסחר או סוגים אחרים של עצות או המלצות שסופקו או מאושרים על ידי TradingView. קרא עוד בתנאים וההגבלות.
כתב ויתור
המידע והפרסומים אינם אמורים להיות, ואינם מהווים, עצות פיננסיות, השקעות, מסחר או סוגים אחרים של עצות או המלצות שסופקו או מאושרים על ידי TradingView. קרא עוד בתנאים וההגבלות.