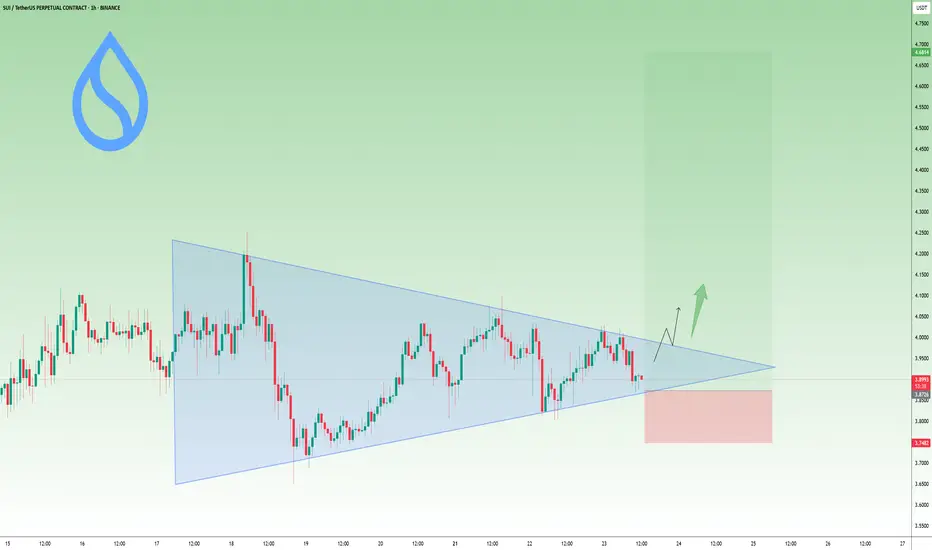
The price is getting tighter, forming higher lows and lower highs.
This usually means a breakout is coming soon.
If it breaks above the triangle with strong volume, SUI could jump to the $4.60–$4.70 range.
For now, it’s a wait-and-watch setup.
Key support is just below $3.85, staying above that keeps the bullish trend alive.
#Altseason2025
Register on Blofin, Toobit and BingX and trade with me: 👇
toobit.com/t/CryptoMojo
partner.blofin.com/d/Cryptomojo
bingx.com/invite/WKCI5X/
Free TG Daily Futures Signals: 👉 t.me/CRYPTOMOJO_TA
toobit.com/t/CryptoMojo
partner.blofin.com/d/Cryptomojo
bingx.com/invite/WKCI5X/
Free TG Daily Futures Signals: 👉 t.me/CRYPTOMOJO_TA
כתב ויתור
המידע והפרסומים אינם אמורים להיות, ואינם מהווים, עצות פיננסיות, השקעות, מסחר או סוגים אחרים של עצות או המלצות שסופקו או מאושרים על ידי TradingView. קרא עוד בתנאים וההגבלות.