📈 Key numbers & technical indicators
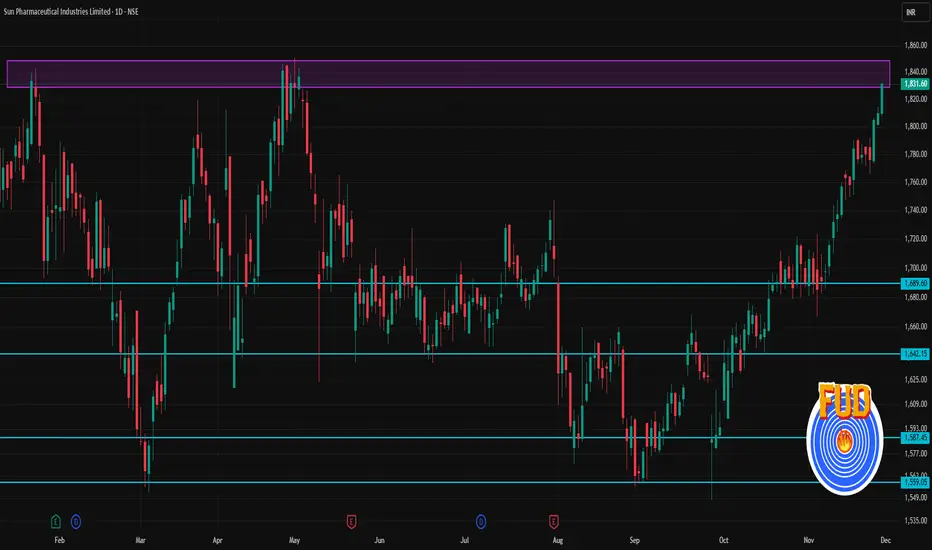
Last close: ~₹ 1,831.60
Pivot point: ~₹ 1,824.03
Immediate resistance (R1‑R3): ~₹ 1,840.6 → ₹ 1,849.5 → ₹ 1,866.1
Immediate support (S1‑S3): ~₹ 1,815.1 → ₹ 1,798.5 → ₹ 1,789.6
Moving averages: 20‑day ~₹ 1,758.6, 50‑day ~₹ 1,711.7, 100‑day ~₹ 1,690.8, 200‑day ~₹ 1,686.6 — stock is comfortably above all, indicating overall bullishness.
✅ What this suggests now (1‑day / short‑term view)
As long as price stays above pivot (~₹ 1,824), the near‑term bias remains mildly bullish.
If price breaks and sustains above first resistance levels (~₹ 1,840–1,850), next resistance zone near ~₹ 1,865 may come into play.
On downside, if price slips below support zone (~₹ 1,815–₹ 1,798), watch for further weakness toward ~₹ 1,789–₹ 1,775.
פרסומים קשורים
כתב ויתור
המידע והפרסומים אינם מיועדים להיות, ואינם מהווים, ייעוץ או המלצה פיננסית, השקעתית, מסחרית או מכל סוג אחר המסופקת או מאושרת על ידי TradingView. קרא עוד ב־תנאי השימוש.
פרסומים קשורים
כתב ויתור
המידע והפרסומים אינם מיועדים להיות, ואינם מהווים, ייעוץ או המלצה פיננסית, השקעתית, מסחרית או מכל סוג אחר המסופקת או מאושרת על ידי TradingView. קרא עוד ב־תנאי השימוש.