🎯 Key Levels
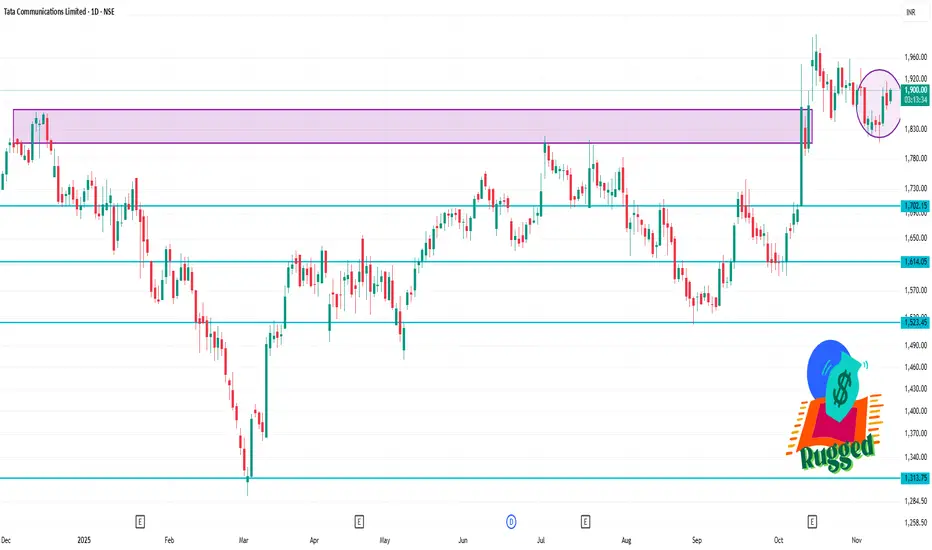
Current price (recent quote): ~ ₹1,876.
Pivot levels (daily classic):
Pivot ≈ ₹1,895.73
Support 1 (S1) ≈ ₹1,890.36
Resistance 1 (R1) ≈ ₹1,900.86
Additional support/resistance: S2 ≈ ₹1,885.23, R2 ≈ ₹1,906.23
Moving Average supports:
50-day SMA ≈ ₹1,858.81
100-day SMA ≈ ₹1,882.54
200-day SMA ≈ ₹1,846.83
✅ Trading Implications
If the stock manages to break and hold above the pivot (~₹1,895.7), then the next target is near ₹1,900–₹1,906 (R1/R2 area).
If it fails and drops below support levels (~₹1,890 and ~₹1,885), then watch for deeper support around the 50-day SMA (~₹1,858) or even ~₹1,846 (200-day SMA) in a more significant correction.
Given the bullish indicators, the preferred scenario is a break to the upside, but one must be aware of risk of reversal/weakness if momentum fades.
פרסומים קשורים
כתב ויתור
המידע והפרסומים אינם מיועדים להיות, ואינם מהווים, ייעוץ או המלצה פיננסית, השקעתית, מסחרית או מכל סוג אחר המסופקת או מאושרת על ידי TradingView. קרא עוד ב־תנאי השימוש.
פרסומים קשורים
כתב ויתור
המידע והפרסומים אינם מיועדים להיות, ואינם מהווים, ייעוץ או המלצה פיננסית, השקעתית, מסחרית או מכל סוג אחר המסופקת או מאושרת על ידי TradingView. קרא עוד ב־תנאי השימוש.