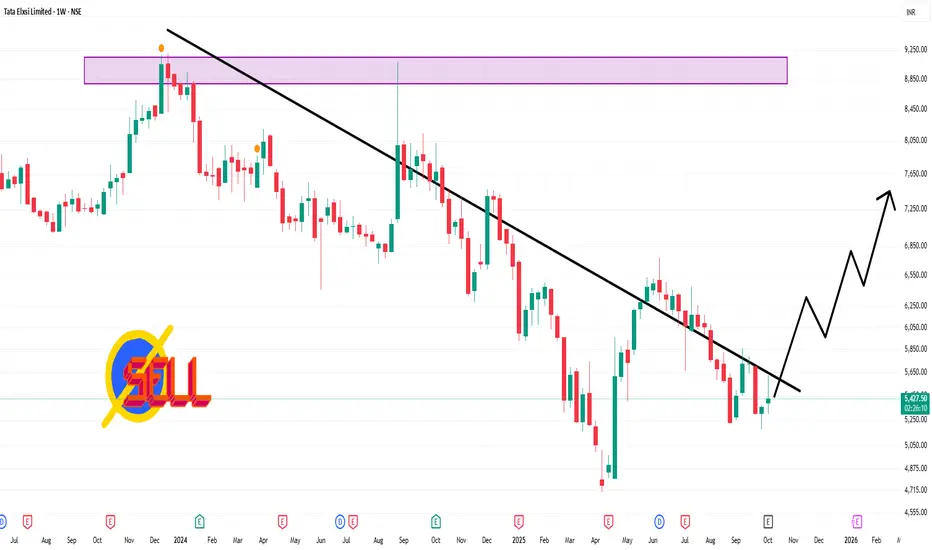
📉 Technical Outlook (Weekly Timeframe)
Technical Rating: The prevailing trend is a strong sell, supported by indicators such as moving averages and oscillators.
Pivot Levels:
Weekly Pivot Point: ₹5,300.33
Support Levels:
S1: ₹5,272.75
S2: ₹5,106.83
Resistance Levels:
R1: ₹5,493.83
R2: ₹5,618.17
Central Pivot Range: ₹5,272.75 – ₹5,300.33 – ₹5,327.92
Relative Strength Index (RSI): The 14-day RSI is approximately 48.6, indicating a neutral condition.
Moving Averages:
50-day MA: ₹5,362.89 (Buy)
200-day MA: ₹5,503.06 (Sell)
5-day MA: ₹5,468.50 (Sell)
10-day MA: ₹5,502.65 (Sell)
20-day MA: ₹5,468.57 (Sell)
פרסומים קשורים
כתב ויתור
המידע והפרסומים אינם אמורים להיות, ואינם מהווים, עצות פיננסיות, השקעות, מסחר או סוגים אחרים של עצות או המלצות שסופקו או מאושרים על ידי TradingView. קרא עוד בתנאים וההגבלות.
פרסומים קשורים
כתב ויתור
המידע והפרסומים אינם אמורים להיות, ואינם מהווים, עצות פיננסיות, השקעות, מסחר או סוגים אחרים של עצות או המלצות שסופקו או מאושרים על ידי TradingView. קרא עוד בתנאים וההגבלות.