📊 Tata Steel Monthly Chart Analysis
Indicators: RSI Divergence, Volume Contraction, and Market Structure
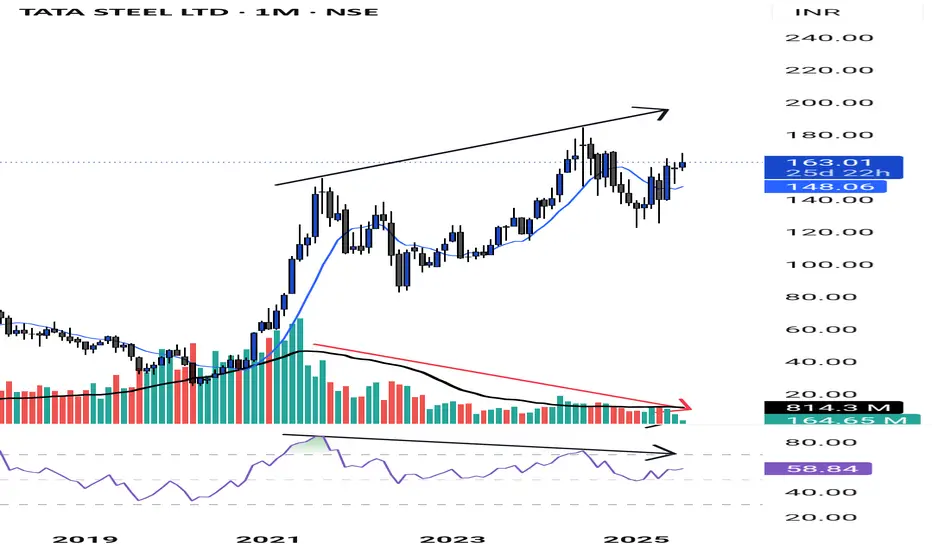
In the monthly chart of Tata Steel, we can observe some crucial technical signals that traders should pay attention to:
🔻 1. Volume Contraction
The volumes are gradually contracting, indicating a reduction in participation and momentum. This often signals a potential reversal or a consolidation phase in the market.
📉 2. RSI Divergence
A clear RSI divergence is forming—while the price is making higher highs, the RSI is forming lower lows. This reflects a loss of strength in the uptrend and a weakening momentum.
⚠️ Note:
There’s a common misconception that RSI divergence always leads to a price fall. While it can be an early warning signal, we do not take trades based solely on RSI divergence. Instead, we confirm signals using market structure and volume.
✅ Confirmation Using Market Structure
To validate the divergence, we also check:
Market Structure – Patterns like higher highs/higher lows or lower highs/lower lows.
Volume Behavior – Are volumes expanding or contracting?
Only when these elements align do we consider it a reliable trade setup—as discussed in Part 1 and Part 2 of our sessions.
📌 Five Key Steps for Analyzing Any Stock
Whether trading cash, futures, or options, follow this proven five-step approach:
1. Start with the Monthly Timeframe
This is a golden rule.
Never begin with a smaller timeframe. The monthly chart gives you the most reliable trend information. On the monthly chart:
Identify the latest swing high and swing low
Check if the price is above the 9-period SMA
2. Check Volume on Monthly Chart
Observe what the volume is doing:
Increasing? Decreasing? Flat?
Volume behavior gives deeper insight into the strength or weakness of the trend.
3. Look for RSI Divergence on Monthly
Is there a mismatch between price and momentum?
If the RSI shows divergence while prices climb, it could indicate an upcoming reversal.
4. Repeat the Process on Weekly and Daily Charts
Once the monthly chart confirms your bias:
Move to the weekly chart. Check if it is also above the 9 SMA.
Then check the daily for potential entry setups.
📌 Often, the weekly and daily charts will give earlier signals of 9 SMA crossovers before the monthly confirms the trend.
5. Confirm Trend and Set Risk Management Rules
Identify the ongoing trend:
Uptrend: Higher highs and higher lows
Downtrend: Lower highs and lower lows
Set your trade plan:
Stop Loss (SL): Below the previous swing low
Target: Based on the swing high from a higher timeframe
📈 Final Thoughts
To trade effectively, align these five elements:
Higher timeframe confirmation (start with monthly)
Volume behavior
RSI divergence
Market structure
Solid risk management plan
Only when all conditions align should a trade be considered.
This structured approach prevents emotional trading and increases the probability of success.
List of 50 NSE liquid stocks - RELIANCE, INFY, HDFCBANK, ICICIBANK, SBI, TATAMOTORS, TATASTEEL
AXISBANK, BAJFINANCE, LT, ITC, TCS, HINDALCO, POWERGRID, BHARTIARTL, MARICO
HINDUNILVR, NTPC, ONGC, WIPRO, SBIN, COALINDIA, GRASIM, M&M, ULTRACEMCO
HDFC, CIPLA, EICHERMOT, NESTLEIND, BRITANNIA, ASIANPAINT, SUNPHARMA, DRREDDY
AMBUJACEM, TATACHEM, GODREJPROP, INDUSINDBK, CANBK, IOC, PFC, RECLTD
BIOCON, HINDPETRO, NTPC, PETRONET, SBILIFE, LAURUSLABS, COLPAL, BAJFINANCE
Add to your watchlist. Only trade in these.
Please leave a comment if you have any doubts. God bless you all!
Indicators: RSI Divergence, Volume Contraction, and Market Structure
In the monthly chart of Tata Steel, we can observe some crucial technical signals that traders should pay attention to:
🔻 1. Volume Contraction
The volumes are gradually contracting, indicating a reduction in participation and momentum. This often signals a potential reversal or a consolidation phase in the market.
📉 2. RSI Divergence
A clear RSI divergence is forming—while the price is making higher highs, the RSI is forming lower lows. This reflects a loss of strength in the uptrend and a weakening momentum.
⚠️ Note:
There’s a common misconception that RSI divergence always leads to a price fall. While it can be an early warning signal, we do not take trades based solely on RSI divergence. Instead, we confirm signals using market structure and volume.
✅ Confirmation Using Market Structure
To validate the divergence, we also check:
Market Structure – Patterns like higher highs/higher lows or lower highs/lower lows.
Volume Behavior – Are volumes expanding or contracting?
Only when these elements align do we consider it a reliable trade setup—as discussed in Part 1 and Part 2 of our sessions.
📌 Five Key Steps for Analyzing Any Stock
Whether trading cash, futures, or options, follow this proven five-step approach:
1. Start with the Monthly Timeframe
This is a golden rule.
Never begin with a smaller timeframe. The monthly chart gives you the most reliable trend information. On the monthly chart:
Identify the latest swing high and swing low
Check if the price is above the 9-period SMA
2. Check Volume on Monthly Chart
Observe what the volume is doing:
Increasing? Decreasing? Flat?
Volume behavior gives deeper insight into the strength or weakness of the trend.
3. Look for RSI Divergence on Monthly
Is there a mismatch between price and momentum?
If the RSI shows divergence while prices climb, it could indicate an upcoming reversal.
4. Repeat the Process on Weekly and Daily Charts
Once the monthly chart confirms your bias:
Move to the weekly chart. Check if it is also above the 9 SMA.
Then check the daily for potential entry setups.
📌 Often, the weekly and daily charts will give earlier signals of 9 SMA crossovers before the monthly confirms the trend.
5. Confirm Trend and Set Risk Management Rules
Identify the ongoing trend:
Uptrend: Higher highs and higher lows
Downtrend: Lower highs and lower lows
Set your trade plan:
Stop Loss (SL): Below the previous swing low
Target: Based on the swing high from a higher timeframe
📈 Final Thoughts
To trade effectively, align these five elements:
Higher timeframe confirmation (start with monthly)
Volume behavior
RSI divergence
Market structure
Solid risk management plan
Only when all conditions align should a trade be considered.
This structured approach prevents emotional trading and increases the probability of success.
List of 50 NSE liquid stocks - RELIANCE, INFY, HDFCBANK, ICICIBANK, SBI, TATAMOTORS, TATASTEEL
AXISBANK, BAJFINANCE, LT, ITC, TCS, HINDALCO, POWERGRID, BHARTIARTL, MARICO
HINDUNILVR, NTPC, ONGC, WIPRO, SBIN, COALINDIA, GRASIM, M&M, ULTRACEMCO
HDFC, CIPLA, EICHERMOT, NESTLEIND, BRITANNIA, ASIANPAINT, SUNPHARMA, DRREDDY
AMBUJACEM, TATACHEM, GODREJPROP, INDUSINDBK, CANBK, IOC, PFC, RECLTD
BIOCON, HINDPETRO, NTPC, PETRONET, SBILIFE, LAURUSLABS, COLPAL, BAJFINANCE
Add to your watchlist. Only trade in these.
Please leave a comment if you have any doubts. God bless you all!
כתב ויתור
המידע והפרסומים אינם אמורים להיות, ואינם מהווים, עצות פיננסיות, השקעות, מסחר או סוגים אחרים של עצות או המלצות שסופקו או מאושרים על ידי TradingView. קרא עוד בתנאים וההגבלות.
כתב ויתור
המידע והפרסומים אינם אמורים להיות, ואינם מהווים, עצות פיננסיות, השקעות, מסחר או סוגים אחרים של עצות או המלצות שסופקו או מאושרים על ידי TradingView. קרא עוד בתנאים וההגבלות.