3. Tata Technologies Ltd
- Analysis:
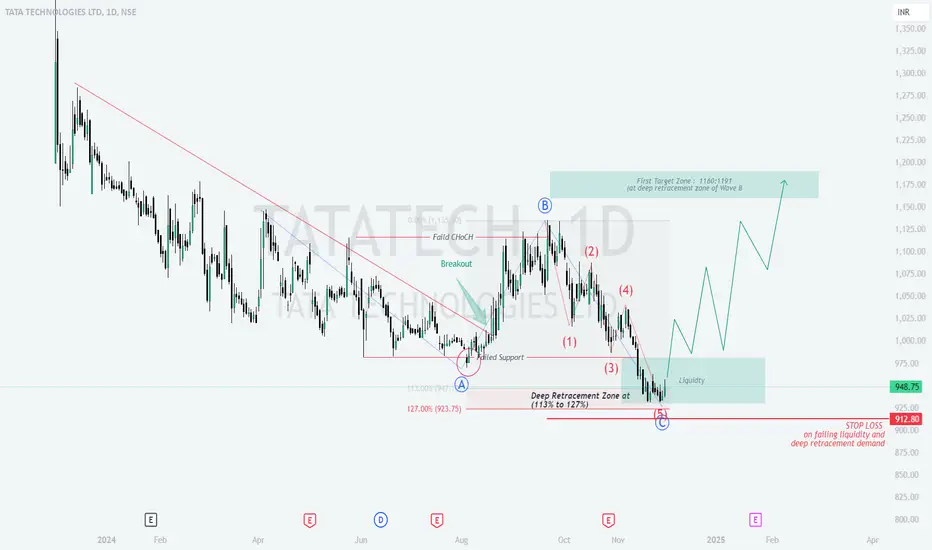
Wave Structure: A 5-wave corrective structure with Wave C reaching a deep retracement zone (113%-127% of Wave A).
Liquidity Zone: Indicates possible institutional accumulation near current levels.
Target Zone: Marked at 1160-1191 INR, aligning with Wave B retracement levels.
Stop Loss: Placed at 912.80 INR, just below the support zone. - Trading Plan:
Action: Initiate buy positions at current levels (948.75 INR) or near the 923-912 zone if prices dip.
Stop Loss: Place at 912.80 INR.
Targets:
First Target: 1160 INR.
Final Target: 1191 INR. - Reasoning:
Confluence of support in the retracement zone suggests potential for reversal.
Target aligns with historical resistance, providing logical exit levels.
כתב ויתור
המידע והפרסומים אינם מיועדים להיות, ואינם מהווים, ייעוץ או המלצה פיננסית, השקעתית, מסחרית או מכל סוג אחר המסופקת או מאושרת על ידי TradingView. קרא עוד ב־תנאי השימוש.
כתב ויתור
המידע והפרסומים אינם מיועדים להיות, ואינם מהווים, ייעוץ או המלצה פיננסית, השקעתית, מסחרית או מכל סוג אחר המסופקת או מאושרת על ידי TradingView. קרא עוד ב־תנאי השימוש.