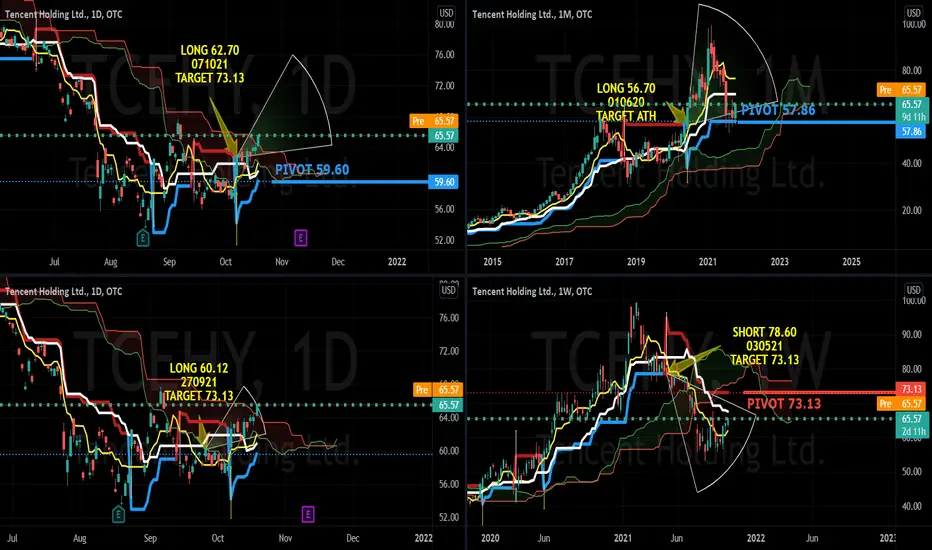
TCEHY has been on a medium term downtrend since 030521 since the short signal issued at $78.60. The long term charts is still long from 010620 at $56.70. A break above the weekly supertrend resistance at $73.13 may resume the uptrend supported by a long signal on the day charts at $62.70 on 071021
Long Term UPTREND since 010620
Medium Term DOWNTREND since 030521
Short Term BASEFORMING since 071021
PIVOT 73.13
Short positions below 73.13 for 59.60 and 41.26
Long positions above 73.13 for 99.40 and new ATH
Long Term UPTREND since 010620
Medium Term DOWNTREND since 030521
Short Term BASEFORMING since 071021
PIVOT 73.13
Short positions below 73.13 for 59.60 and 41.26
Long positions above 73.13 for 99.40 and new ATH
Quant Strategic Singapore
כתב ויתור
המידע והפרסומים אינם אמורים להיות, ואינם מהווים, עצות פיננסיות, השקעות, מסחר או סוגים אחרים של עצות או המלצות שסופקו או מאושרים על ידי TradingView. קרא עוד בתנאים וההגבלות.
Quant Strategic Singapore
כתב ויתור
המידע והפרסומים אינם אמורים להיות, ואינם מהווים, עצות פיננסיות, השקעות, מסחר או סוגים אחרים של עצות או המלצות שסופקו או מאושרים על ידי TradingView. קרא עוד בתנאים וההגבלות.