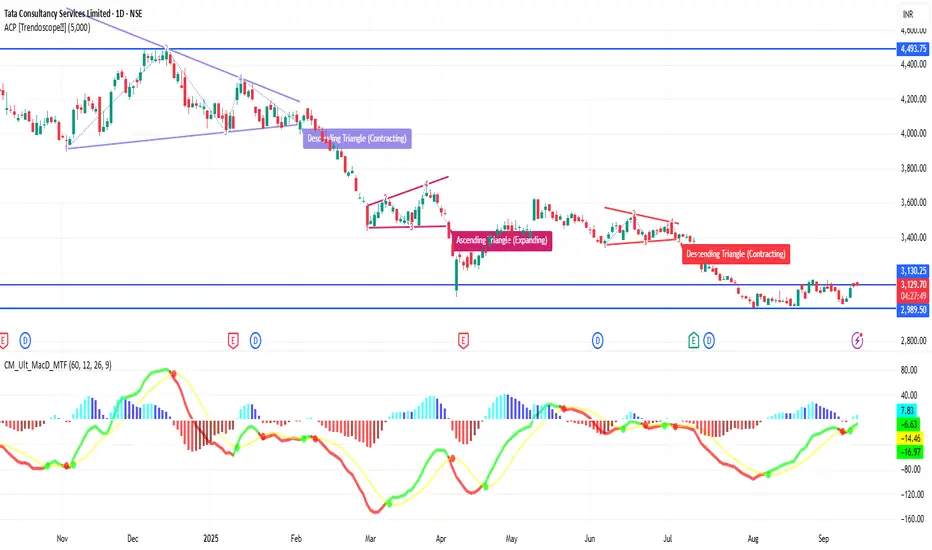
🔢 Current Level
Trading around ₹3,125 – ₹3,135
🔑 Key Resistance & Support Levels
Resistance Zones:
₹3,138 – ₹3,153 (near-term resistance; breakout above this may lead to further upside)
₹3,167 (stronger resistance above)
Support Zones:
₹3,095 – ₹3,110 (immediate support)
₹3,080 (stronger support if price dips further)
₹3,050 – ₹3,060 (deeper support zone)
📉 Outlook
Bullish Scenario: If TCS holds above ₹3,110, upward momentum may continue. Break above ₹3,153 can open the way toward ₹3,167+.
Bearish Scenario: If it falls below ₹3,080, risk increases toward ₹3,050.
Neutral / Range: Between ₹3,110 – ₹3,153, TCS may consolidate before a directional move.
פרסומים קשורים
כתב ויתור
המידע והפרסומים אינם מיועדים להיות, ואינם מהווים, ייעוץ או המלצה פיננסית, השקעתית, מסחרית או מכל סוג אחר המסופקת או מאושרת על ידי TradingView. קרא עוד ב־תנאי השימוש.
פרסומים קשורים
כתב ויתור
המידע והפרסומים אינם מיועדים להיות, ואינם מהווים, ייעוץ או המלצה פיננסית, השקעתית, מסחרית או מכל סוג אחר המסופקת או מאושרת על ידי TradingView. קרא עוד ב־תנאי השימוש.