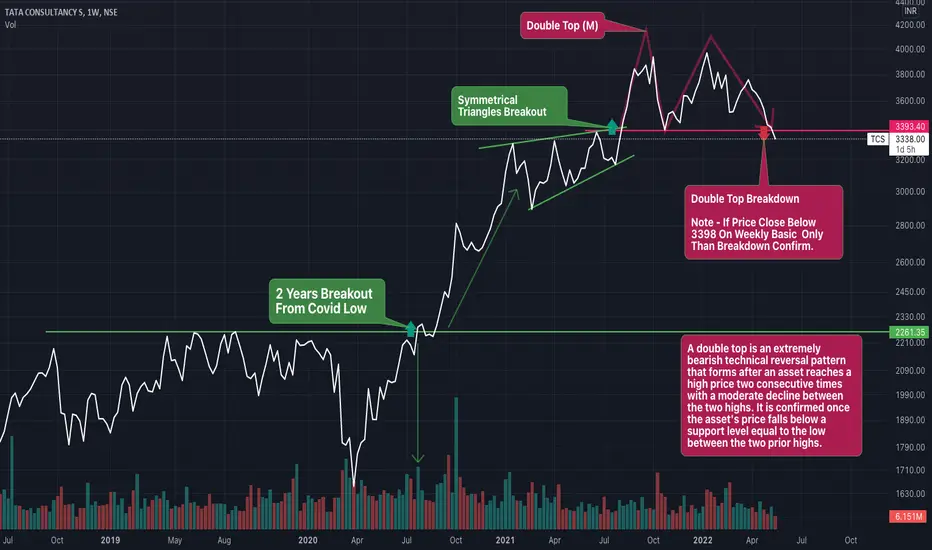
Be Cautious Double Top Pattern (trend reversal ) at #TCS [Tata Consultancy Services Ltd] weekly chart.
A double top is an extremely bearish technical reversal pattern that forms after an asset reaches a high price two consecutive times with a moderate decline between the two highs. It is confirmed once the asset's price falls below a support level equal to the low between the two prior highs.
NOTE- INVESTED #TCS
ONLY FOR #educational
NOT SEBI REGISTERED. #LEARNEARN (DONT TRUST ANYONE)
#nifty50 #sharemarket #BREAKOUTSTOCKS #Multibagger #sharemarket #sharemarketindia #sensex #technicalanalysis #kukiinvest #Chartanalysis #headandshoulders #doubletop #doublebottom
כתב ויתור
המידע והפרסומים אינם מיועדים להיות, ואינם מהווים, ייעוץ או המלצה פיננסית, השקעתית, מסחרית או מכל סוג אחר המסופקת או מאושרת על ידי TradingView. קרא עוד ב־תנאי השימוש.
כתב ויתור
המידע והפרסומים אינם מיועדים להיות, ואינם מהווים, ייעוץ או המלצה פיננסית, השקעתית, מסחרית או מכל סוג אחר המסופקת או מאושרת על ידי TradingView. קרא עוד ב־תנאי השימוש.