As of April 29, 2025, here are the key support and resistance levels for Tourism Finance Corporation of India Ltd. (TFCILTD) based on recent technical analyses:
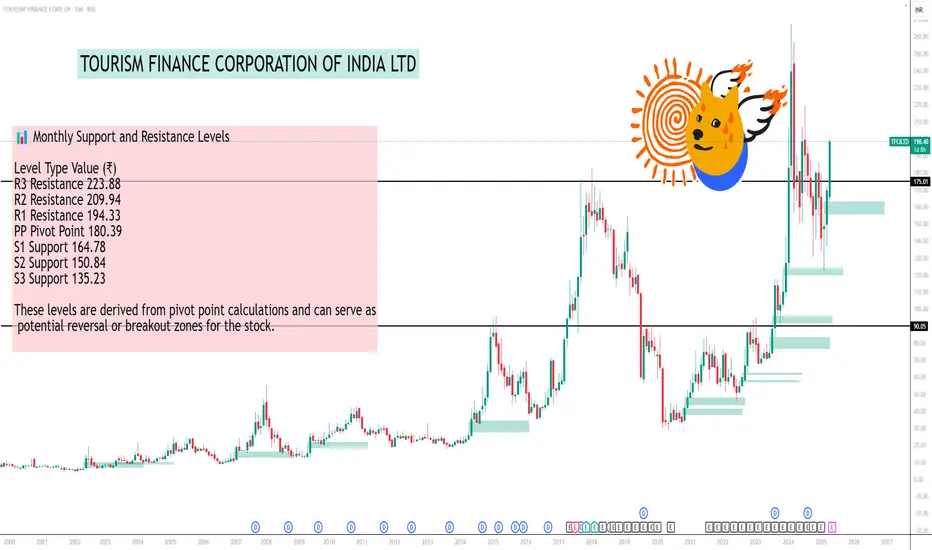
📊 Monthly Support and Resistance Levels
Level Type Value (₹)
R3 Resistance 223.88
R2 Resistance 209.94
R1 Resistance 194.33
PP Pivot Point 180.39
S1 Support 164.78
S2 Support 150.84
S3 Support 135.23
These levels are derived from pivot point calculations and can serve as potential reversal or breakout zones for the stock.
📈 Additional Technical Indicators
Relative Strength Index (RSI): 56.41, indicating a neutral to slightly bullish momentum.
Moving Averages:
20-Day SMA: ₹137.90
50-Day SMA: ₹152.87
פרסומים קשורים
כתב ויתור
המידע והפרסומים אינם אמורים להיות, ואינם מהווים, עצות פיננסיות, השקעות, מסחר או סוגים אחרים של עצות או המלצות שסופקו או מאושרים על ידי TradingView. קרא עוד בתנאים וההגבלות.
פרסומים קשורים
כתב ויתור
המידע והפרסומים אינם אמורים להיות, ואינם מהווים, עצות פיננסיות, השקעות, מסחר או סוגים אחרים של עצות או המלצות שסופקו או מאושרים על ידי TradingView. קרא עוד בתנאים וההגבלות.