TGS (TGS Ltd.) – Breakout Play with Strong Upside Potential
🚀 Trade Idea: TGS (TGS Ltd.) – Breakout Play with Strong Upside Potential
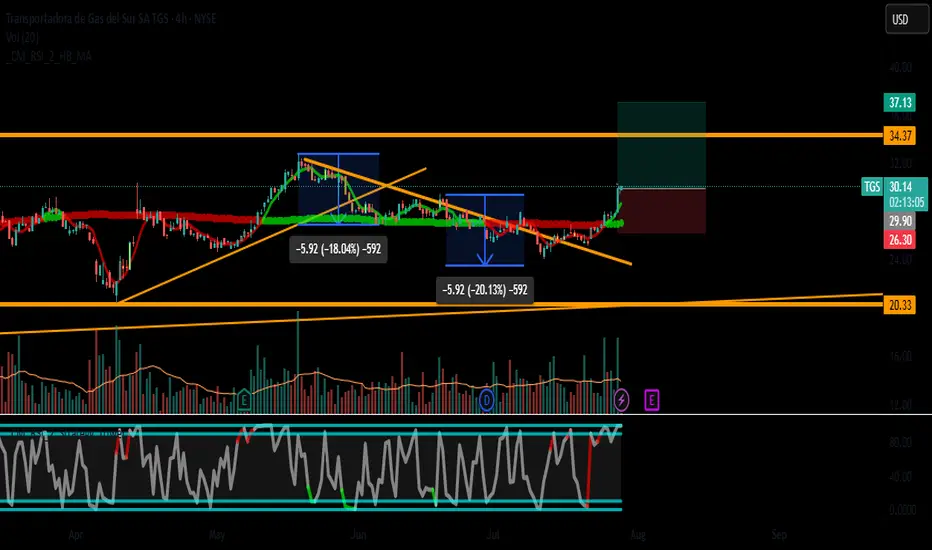
📈 Entry: $29.90 (Breakout above resistance)
🛑 Stop Loss: $26.30 (Below key support & SMA-50)
🎯 Take Profit: $37.13 (~24% upside, near next resistance zone)
📊 Risk-Reward Ratio: 1:3 (Favorable setup)
🔍 Analysis Breakdown
📊 Technical Setup
Trend: Daily trend is consolidating, but 4H/1H show bullish momentum.
Key Levels:
Support: $26.30 (SMA-50 & recent swing low).
Resistance: $30 (psychological level, previous highs).
Indicators:
MACD (4H): Bullish crossover, supporting upside.
RSI (Daily): ~65 (neutral, no overbought signal yet).
Volume: Increasing on upward moves (confirms interest).
💰 Fundamental Backing
Strong Revenue & Earnings Growth (See previous analysis).
Undervalued Metrics (P/B, P/S) suggest room for expansion.
Low Debt (Score: 10/10) reduces downside risk.
🎯 Why This Trade?
✅ Breakout Play: A close above $30 confirms bullish continuation.
✅ Strong Fundamentals: Earnings growth supports higher valuation.
✅ Low-Risk Entry: Tight stop below support.
⚠️ Key Risks:
Failure to hold $30 could lead to retest of $26.30.
Market-wide pullback could delay momentum.
📉 Trade Management
Add-on: Consider scaling in above $31.50 (confirmation of trend).
Trailing Stop: Move SL to $28.50 after hitting $33.
📌 Final Thought: TGS has strong upside potential if it breaks $30. The 1:3 R/R makes this a high-conviction trade.
👨💻 Let me know your thoughts in the comments!
#TGS #Breakout #Stocks #Trading #Investing
Disclaimer: Not financial advice. Do your own research before trading.
כתב ויתור
המידע והפרסומים אינם אמורים להיות, ואינם מהווים, עצות פיננסיות, השקעות, מסחר או סוגים אחרים של עצות או המלצות שסופקו או מאושרים על ידי TradingView. קרא עוד בתנאים וההגבלות.
כתב ויתור
המידע והפרסומים אינם אמורים להיות, ואינם מהווים, עצות פיננסיות, השקעות, מסחר או סוגים אחרים של עצות או המלצות שסופקו או מאושרים על ידי TradingView. קרא עוד בתנאים וההגבלות.