TIINDIA Technical Analysis|Ascending Triangle Breakout Explained
📊 TIINDIA Trade Analysis
🔎 Price Action
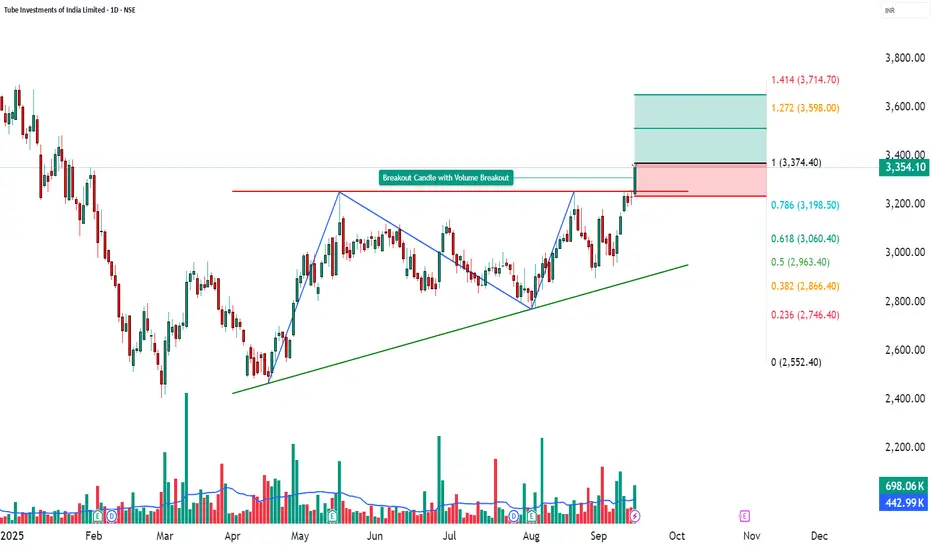
TIINDIA closed at ₹3354.1 with a strong +3.8% gain, backed by a volume of 6.98 lakh, which is well above its 20-day average volume of 4.43 lakh (VolX = 1.26x).
This surge confirms strong buyer participation, supporting bullish momentum and indicating sustained strength in the uptrend.
________________________________________
📉 Chart Signals: Ascending Triangle Pattern
Strong bullish breakout candle with heavy volumes.
RSI breakout confirming underlying strength.
Bollinger Band breakout after squeeze → fresh volatility expansion and potential sustained upside.
________________________________________
📍 Key Levels
Resistance: 3405 – 3457 – 3540
Support: 3271 – 3188 – 3136
________________________________________
📈 Investment Outlook
📈 Bullish Case – Why the stock could go up
Strong bullish candle signals momentum revival.
Breakout backed by 698k vs 443k avg volume (VolX 1.26x) → strong participation.
RSI (69.1) + CCI (195) + Stochastic (95) confirm momentum.
Upside potential toward ₹3514 – ₹3653 if momentum sustains.
📉 Bearish Case – Potential downside risks
Failure to hold above ₹3374 could trigger profit booking.
Broader market or sector weakness may drag stock back to supports.
A break below ₹3270 could shift bias to downside and test ₹3188 – ₹3136.
⚡ Momentum Case – Short-term Trading Edge
Volume breakout highlights trader interest.
RSI breakout + Bollinger squeeze signal momentum strength.
Sustaining above ₹3405–₹3457 zone may extend upside to ₹3514–₹3540.
📅 Short-term vs Long-term Perspective
Short-term (1–2 weeks): Momentum-driven moves likely; watch resistances at 3405–3540 and supports at 3271–3188.
Long-term (1–3 months): Stock remains in a structural uptrend; if volumes stay above average and fundamentals support, dips toward ₹3180–₹3130 may act as re-entry zones for study.
________________________________________
📝 STWP Trade Analysis
Outlook: Momentum: Strong, Trend: Bullish
Entry: 3374.4 – 3354.10 | Stop-loss: 3234.92
Target-1: 3513.88 | Target-2: 3653.36
Risk/Reward: 1:3.55 | Risk: Low | Volume: High
Demand Zone: 3260-3190 | SL: 3185.05
Learning Note: TIINDIA is in a strong momentum phase, with supports well-positioned for short-term trend analysis.
________________________________________
⚠️ Disclaimer – Please Read Carefully
The information shared here is meant purely for learning and awareness. It is not a buy or sell recommendation and should not be taken as investment advice. I am not a SEBI-registered investment advisor, and all views expressed are based on personal study, chart patterns, and publicly available market data.
Trading — whether in stocks or options — carries risk. Markets can move unexpectedly, and losses can sometimes exceed the money you have invested. Past performance or past setups do not guarantee future results.
If you are a beginner, treat this as a guide to understand how the market works — practice on paper trades before risking real money. If you are experienced, always assess your own risk, position sizing, and strategy suitability before entering trades.
Consult a SEBI-registered financial advisor before making any real trading decision. By engaging with this content, you acknowledge full responsibility for your trades and investments.
💬 Found this useful?
🔼 Give this post a Boost to help more traders discover clean, structured learning.
✍️ Drop your thoughts, questions, or setups in the comments — let’s grow together!
🔁 Share with fellow traders and beginners to spread awareness.
👉 “If you liked this breakdown, follow for more clean, structured setups with discipline at the core.”
🚀 Stay Calm. Stay Clean. Trade With Patience.
Trade Smart | Learn Zones | Be Self-Reliant 📊
🔎 Price Action
TIINDIA closed at ₹3354.1 with a strong +3.8% gain, backed by a volume of 6.98 lakh, which is well above its 20-day average volume of 4.43 lakh (VolX = 1.26x).
This surge confirms strong buyer participation, supporting bullish momentum and indicating sustained strength in the uptrend.
________________________________________
📉 Chart Signals: Ascending Triangle Pattern
Strong bullish breakout candle with heavy volumes.
RSI breakout confirming underlying strength.
Bollinger Band breakout after squeeze → fresh volatility expansion and potential sustained upside.
________________________________________
📍 Key Levels
Resistance: 3405 – 3457 – 3540
Support: 3271 – 3188 – 3136
________________________________________
📈 Investment Outlook
📈 Bullish Case – Why the stock could go up
Strong bullish candle signals momentum revival.
Breakout backed by 698k vs 443k avg volume (VolX 1.26x) → strong participation.
RSI (69.1) + CCI (195) + Stochastic (95) confirm momentum.
Upside potential toward ₹3514 – ₹3653 if momentum sustains.
📉 Bearish Case – Potential downside risks
Failure to hold above ₹3374 could trigger profit booking.
Broader market or sector weakness may drag stock back to supports.
A break below ₹3270 could shift bias to downside and test ₹3188 – ₹3136.
⚡ Momentum Case – Short-term Trading Edge
Volume breakout highlights trader interest.
RSI breakout + Bollinger squeeze signal momentum strength.
Sustaining above ₹3405–₹3457 zone may extend upside to ₹3514–₹3540.
📅 Short-term vs Long-term Perspective
Short-term (1–2 weeks): Momentum-driven moves likely; watch resistances at 3405–3540 and supports at 3271–3188.
Long-term (1–3 months): Stock remains in a structural uptrend; if volumes stay above average and fundamentals support, dips toward ₹3180–₹3130 may act as re-entry zones for study.
________________________________________
📝 STWP Trade Analysis
Outlook: Momentum: Strong, Trend: Bullish
Entry: 3374.4 – 3354.10 | Stop-loss: 3234.92
Target-1: 3513.88 | Target-2: 3653.36
Risk/Reward: 1:3.55 | Risk: Low | Volume: High
Demand Zone: 3260-3190 | SL: 3185.05
Learning Note: TIINDIA is in a strong momentum phase, with supports well-positioned for short-term trend analysis.
________________________________________
⚠️ Disclaimer – Please Read Carefully
The information shared here is meant purely for learning and awareness. It is not a buy or sell recommendation and should not be taken as investment advice. I am not a SEBI-registered investment advisor, and all views expressed are based on personal study, chart patterns, and publicly available market data.
Trading — whether in stocks or options — carries risk. Markets can move unexpectedly, and losses can sometimes exceed the money you have invested. Past performance or past setups do not guarantee future results.
If you are a beginner, treat this as a guide to understand how the market works — practice on paper trades before risking real money. If you are experienced, always assess your own risk, position sizing, and strategy suitability before entering trades.
Consult a SEBI-registered financial advisor before making any real trading decision. By engaging with this content, you acknowledge full responsibility for your trades and investments.
💬 Found this useful?
🔼 Give this post a Boost to help more traders discover clean, structured learning.
✍️ Drop your thoughts, questions, or setups in the comments — let’s grow together!
🔁 Share with fellow traders and beginners to spread awareness.
👉 “If you liked this breakdown, follow for more clean, structured setups with discipline at the core.”
🚀 Stay Calm. Stay Clean. Trade With Patience.
Trade Smart | Learn Zones | Be Self-Reliant 📊
STWP | Mentor & Demand-Supply Specialist | Empowering traders through structured learning |
simpletradewithpatience.com
Community: chat.whatsapp.com/BEYz0tkqP0fJPBCWf59uel
wa.me/message/6IOPHGOXMGZ4N1
Educational Only
simpletradewithpatience.com
Community: chat.whatsapp.com/BEYz0tkqP0fJPBCWf59uel
wa.me/message/6IOPHGOXMGZ4N1
Educational Only
כתב ויתור
המידע והפרסומים אינם מיועדים להיות, ואינם מהווים, ייעוץ או המלצה פיננסית, השקעתית, מסחרית או מכל סוג אחר המסופקת או מאושרת על ידי TradingView. קרא עוד ב־תנאי השימוש.