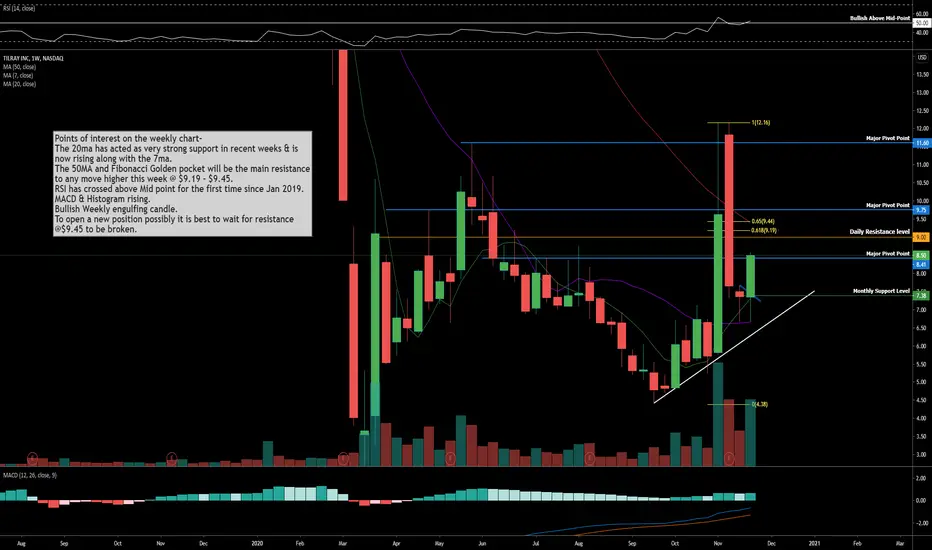
The 20ma has acted as very strong support in recent weeks & is
now rising along with the 7ma.
The 50MA and Fibonacci Golden pocket will be the main resistance
to any move higher this week @ $9.19 - $9.45.
RSI has crossed above Mid point for the first time since Jan 2019.
MACD & Histogram rising.
Bullish Weekly engulfing candle.
To open a new position possibly it is best to wait for resistance
@$9.45 to be broken.
הערה
הערה
The Monthly candle close is so important, expect quite a battle on Monday. Closing above the 8ema 7 ma would be a huge win for bulls.כתב ויתור
המידע והפרסומים אינם אמורים להיות, ואינם מהווים, עצות פיננסיות, השקעות, מסחר או סוגים אחרים של עצות או המלצות שסופקו או מאושרים על ידי TradingView. קרא עוד בתנאים וההגבלות.
כתב ויתור
המידע והפרסומים אינם אמורים להיות, ואינם מהווים, עצות פיננסיות, השקעות, מסחר או סוגים אחרים של עצות או המלצות שסופקו או מאושרים על ידי TradingView. קרא עוד בתנאים וההגבלות.