📌 Key data
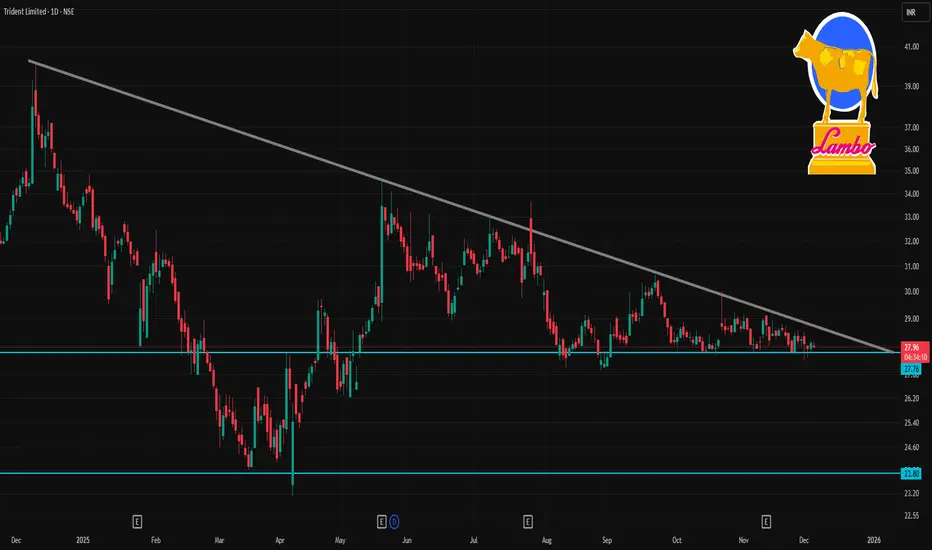
Current price: ~₹28.2.
52-week high / low: ₹40.20 / ₹23.11.
🧭 Pivot / Support / Resistance (1-day based)
Based on a daily pivot-point analysis:
Level Price
Pivot (daily mid) ~ ₹28.02
Resistance 1 (R1) ~ ₹28.32
Resistance 2 (R2) ~ ₹28.53
Support 1 (S1) ~ ₹27.81
Support 2 (S2) ~ ₹27.51
Because the stock is already around ₹28.2, intraday traders might treat ~₹28.5 as a near-term resistance, and ~₹27.5–₹27.8 as the support zone (on a breakdown).
⚠️ What to watch / Risks
Technical signals are mixed: some moving averages are “outperform/positive”, but many oscillators and technical-indicator-based services are still flagging a “sell/neutral” bias on the daily chart.
The stock has underperformed over long term — price is much below 52-wk high, returns have been weak — so volatility or broader market sentiment could sway levels significantly.
פרסומים קשורים
כתב ויתור
המידע והפרסומים אינם מיועדים להיות, ואינם מהווים, ייעוץ או המלצה פיננסית, השקעתית, מסחרית או מכל סוג אחר המסופקת או מאושרת על ידי TradingView. קרא עוד ב־תנאי השימוש.
פרסומים קשורים
כתב ויתור
המידע והפרסומים אינם מיועדים להיות, ואינם מהווים, ייעוץ או המלצה פיננסית, השקעתית, מסחרית או מכל סוג אחר המסופקת או מאושרת על ידי TradingView. קרא עוד ב־תנאי השימוש.