TRUMPUSDT Bear Flag Breakdown or Fakeout? Key Levels to Watch!
📊 TRUMPUSDT 1H Analysis – Bear Flag in Play! 📊
🔻 Current Structure:
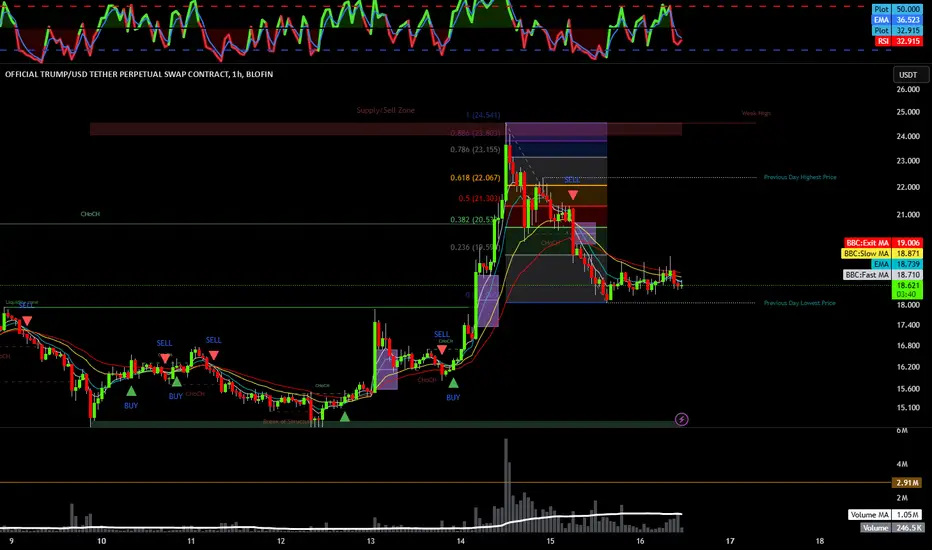
Bear flag formation after rejection from $22.06 (Fib 0.618).
EMA 5, 9, 21, 34 are bearishly aligned, confirming downtrend momentum.
Supply Zone: $24.07 - $24.55 (Major Resistance).
Demand Zone: $14.45 - $14.80 (Last support before deeper sell-off).
📉 Bearish Scenario:
Break below $18.50 = Continuation to $17.50 - $16.00.
Failure to reclaim EMA 21 ($18.86) signals further weakness.
📈 Bullish Invalidation:
Break above $19.50 = Short-term bullish momentum shift.
Above $20.50 (Fib 0.382) → Target $22.00+ if demand steps in.
📍 Key Levels to Watch:
🔸 Bearish Continuation: Below $18.50.
🔸 Bullish Reversal: Above $19.50.
⚡ Is this a bear trap or legit breakdown? Let’s see how price reacts! ⚡
🔻 Current Structure:
Bear flag formation after rejection from $22.06 (Fib 0.618).
EMA 5, 9, 21, 34 are bearishly aligned, confirming downtrend momentum.
Supply Zone: $24.07 - $24.55 (Major Resistance).
Demand Zone: $14.45 - $14.80 (Last support before deeper sell-off).
📉 Bearish Scenario:
Break below $18.50 = Continuation to $17.50 - $16.00.
Failure to reclaim EMA 21 ($18.86) signals further weakness.
📈 Bullish Invalidation:
Break above $19.50 = Short-term bullish momentum shift.
Above $20.50 (Fib 0.382) → Target $22.00+ if demand steps in.
📍 Key Levels to Watch:
🔸 Bearish Continuation: Below $18.50.
🔸 Bullish Reversal: Above $19.50.
⚡ Is this a bear trap or legit breakdown? Let’s see how price reacts! ⚡
עסקה פעילה
Price is stuck below EMAs (5, 9, 21, 34) after breaking structure. Signs of distribution as sellers step in. 🎯 Bias:Bearish to neutral unless price reclaims 18.75 - 19.00 with strength.
Below 18.30, expect continuation lower.
עסקה סגורה: היעד הושג
💡 Liquidity sweep at 16.530 - 15.471 could be a potential Sniper-Level Long entry.כתב ויתור
המידע והפרסומים אינם אמורים להיות, ואינם מהווים, עצות פיננסיות, השקעות, מסחר או סוגים אחרים של עצות או המלצות שסופקו או מאושרים על ידי TradingView. קרא עוד בתנאים וההגבלות.
כתב ויתור
המידע והפרסומים אינם אמורים להיות, ואינם מהווים, עצות פיננסיות, השקעות, מסחר או סוגים אחרים של עצות או המלצות שסופקו או מאושרים על ידי TradingView. קרא עוד בתנאים וההגבלות.