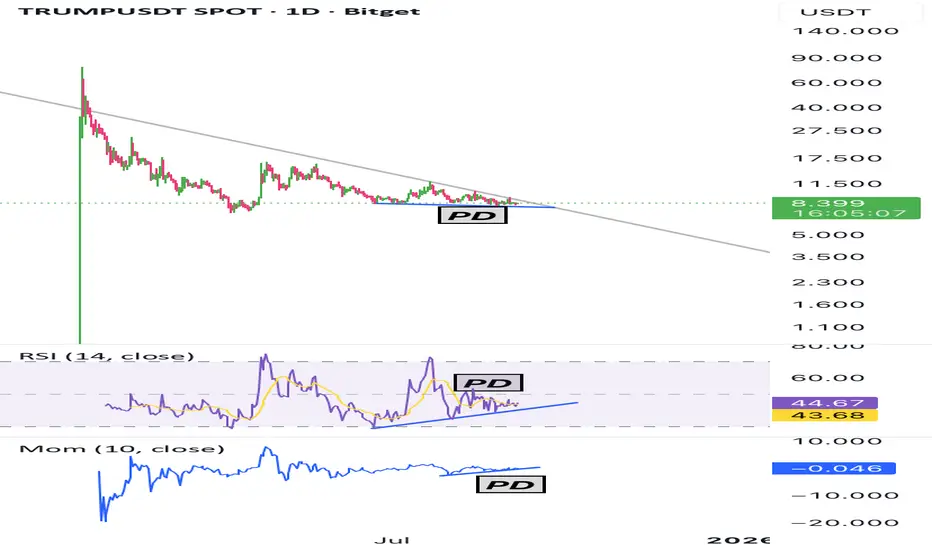
The most notable feature on the chart is the descending triangle formation where the price is consolidating while showing strong bullish divergences across multiple indicators.
🔹 Price Action:
The price keeps making lower lows but finds solid support around the 8 USDT zone, holding near the bottom of the triangle.
🔹 RSI (14):
While the price trends lower, RSI is forming higher lows. This signals weakening selling pressure and growing strength from buyers.
🔹 Momentum (Mom 10):
The Momentum indicator also prints higher lows against the lower price action. This confirms that bearish momentum is fading and increases the probability of an upside breakout.
⚡ Summary:
As the price approaches the apex of the triangle, both RSI and Momentum show strong bullish divergences. This setup may anticipate an upside breakout. A sustained move above 10 USDT could open targets around 13 – 17 – 23 USDT levels.
כתב ויתור
המידע והפרסומים אינם אמורים להיות, ואינם מהווים, עצות פיננסיות, השקעות, מסחר או סוגים אחרים של עצות או המלצות שסופקו או מאושרים על ידי TradingView. קרא עוד בתנאים וההגבלות.
כתב ויתור
המידע והפרסומים אינם אמורים להיות, ואינם מהווים, עצות פיננסיות, השקעות, מסחר או סוגים אחרים של עצות או המלצות שסופקו או מאושרים על ידי TradingView. קרא עוד בתנאים וההגבלות.