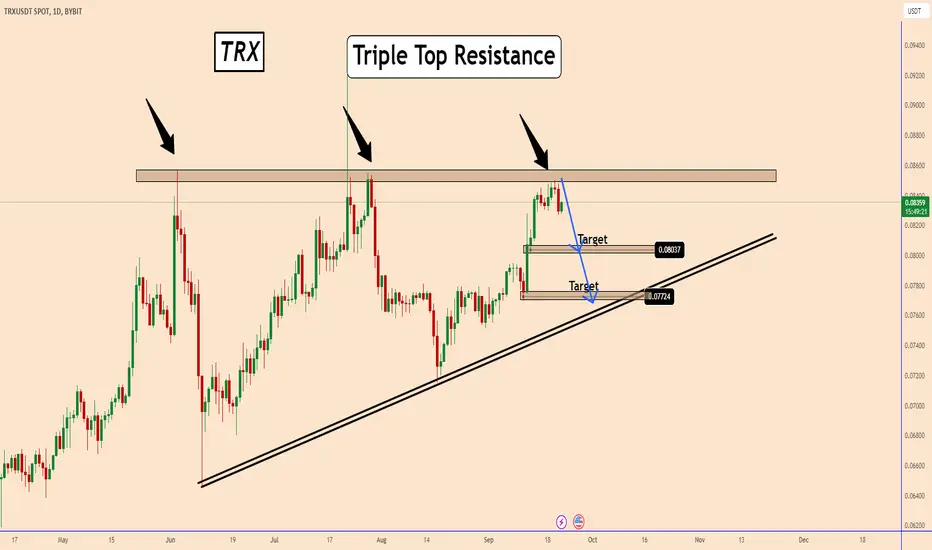
📣#TRX -Triple Top within a daily triangle
ON the daily chart the price is testing a strong key resistance
zone located near 0.08600.
The price reacted two times in that area and the chances
are higher for a bearish wave again.
A sell near 0.0840-0.0845 can give us better trading
opportunities with targets 0.0800 and 0.0770
Thank you and Good Luck!
✅MY FREE Signals Channel
t.me/TradingPuzzles
✅Personal Telegram
t.me/KlejdiCuni
✅Suggested News Channel
t.me/ForexNewsNavigator_Official
t.me/TradingPuzzles
✅Personal Telegram
t.me/KlejdiCuni
✅Suggested News Channel
t.me/ForexNewsNavigator_Official
כתב ויתור
המידע והפרסומים אינם אמורים להיות, ואינם מהווים, עצות פיננסיות, השקעות, מסחר או סוגים אחרים של עצות או המלצות שסופקו או מאושרים על ידי TradingView. קרא עוד בתנאים וההגבלות.