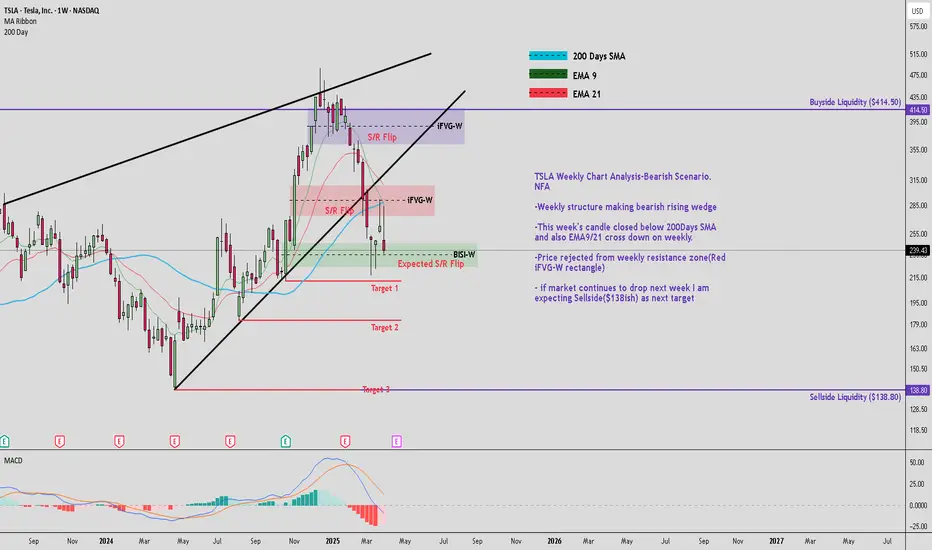
TSLA Weekly Chart Analysis-Bearish Scenario. NFA
-Weekly structure making bearish rising wedge
-This week's candle closed below 200Days SMA and also EMA9/21 cross down on weekly.
-Price rejected from weekly resistance zone(Red iFVG-W rectangle)
- if market continues to drop next week I am expecting Sellside($138ish) as next target
-Weekly structure making bearish rising wedge
-This week's candle closed below 200Days SMA and also EMA9/21 cross down on weekly.
-Price rejected from weekly resistance zone(Red iFVG-W rectangle)
- if market continues to drop next week I am expecting Sellside($138ish) as next target
פרסומים קשורים
כתב ויתור
המידע והפרסומים אינם אמורים להיות, ואינם מהווים, עצות פיננסיות, השקעות, מסחר או סוגים אחרים של עצות או המלצות שסופקו או מאושרים על ידי TradingView. קרא עוד בתנאים וההגבלות.
פרסומים קשורים
כתב ויתור
המידע והפרסומים אינם אמורים להיות, ואינם מהווים, עצות פיננסיות, השקעות, מסחר או סוגים אחרים של עצות או המלצות שסופקו או מאושרים על ידי TradingView. קרא עוד בתנאים וההגבלות.