🚗 TSLA Technical Outlook – Symmetrical Triangle Breakout Watch
Ticker: TSLA (Tesla, Inc.)
Timeframe: 30-minute candles
🔍 Current Setup
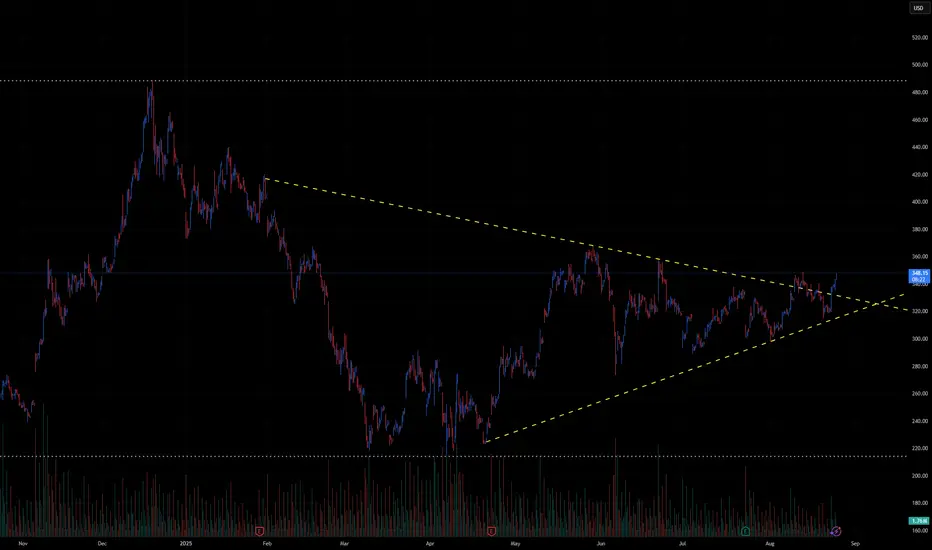
TSLA has been consolidating for months inside a large symmetrical triangle, marked by:
Descending resistance: from ~380 down to ~347.
Ascending support: from April lows near ~240, now rising toward ~320.
Current price: ~348, testing the upper boundary of the triangle.
This structure signals compression after a major downtrend, and the breakout direction will likely define TSLA’s next big move.
📊 Breakout Levels
🚀 Upside (Bullish Scenario)
Trigger: Break and close above 350–355.
Intermediate Targets:
370–380 → First resistance zone.
400–420 → Extension levels.
Measured Move Target: ~450+ (based on the triangle height projection).
🔻 Downside (Bearish Scenario)
Trigger: Failure at resistance and break below 320, confirmation under 310.
Intermediate Supports:
300 → Psychological level.
280–260 → Stronger support zone.
Measured Move Target: ~250 (triangle projection downward).
📈 Volume Analysis
Volume has been contracting steadily during the triangle’s formation.
A major volume spike will be key to confirming whichever direction TSLA chooses.
⚖️ Probability Bias
TSLA is at the make-or-break resistance zone (~350).
A breakout above 355 would strongly favor bulls, targeting 380 → 400+.
But a rejection here and break below 320 would shift momentum bearish, sending TSLA back toward 280–260.
✅ Takeaway
TSLA is at a critical inflection point inside a long-term triangle:
Bullish Break > 355: Targets 370 → 400 → 450+
Bearish Break < 320: Targets 300 → 280 → 250
Watch for volume-backed confirmation, as this move could define Tesla’s next multi-week trend.
Ticker: TSLA (Tesla, Inc.)
Timeframe: 30-minute candles
🔍 Current Setup
TSLA has been consolidating for months inside a large symmetrical triangle, marked by:
Descending resistance: from ~380 down to ~347.
Ascending support: from April lows near ~240, now rising toward ~320.
Current price: ~348, testing the upper boundary of the triangle.
This structure signals compression after a major downtrend, and the breakout direction will likely define TSLA’s next big move.
📊 Breakout Levels
🚀 Upside (Bullish Scenario)
Trigger: Break and close above 350–355.
Intermediate Targets:
370–380 → First resistance zone.
400–420 → Extension levels.
Measured Move Target: ~450+ (based on the triangle height projection).
🔻 Downside (Bearish Scenario)
Trigger: Failure at resistance and break below 320, confirmation under 310.
Intermediate Supports:
300 → Psychological level.
280–260 → Stronger support zone.
Measured Move Target: ~250 (triangle projection downward).
📈 Volume Analysis
Volume has been contracting steadily during the triangle’s formation.
A major volume spike will be key to confirming whichever direction TSLA chooses.
⚖️ Probability Bias
TSLA is at the make-or-break resistance zone (~350).
A breakout above 355 would strongly favor bulls, targeting 380 → 400+.
But a rejection here and break below 320 would shift momentum bearish, sending TSLA back toward 280–260.
✅ Takeaway
TSLA is at a critical inflection point inside a long-term triangle:
Bullish Break > 355: Targets 370 → 400 → 450+
Bearish Break < 320: Targets 300 → 280 → 250
Watch for volume-backed confirmation, as this move could define Tesla’s next multi-week trend.
עסקה פעילה
MASSIVE WIN OVER $420 TODAYכתב ויתור
המידע והפרסומים אינם מיועדים להיות, ואינם מהווים, ייעוץ או המלצה פיננסית, השקעתית, מסחרית או מכל סוג אחר המסופקת או מאושרת על ידי TradingView. קרא עוד ב־תנאי השימוש.
כתב ויתור
המידע והפרסומים אינם מיועדים להיות, ואינם מהווים, ייעוץ או המלצה פיננסית, השקעתית, מסחרית או מכל סוג אחר המסופקת או מאושרת על ידי TradingView. קרא עוד ב־תנאי השימוש.