TSLA QuantSignals Katy 1M Prediction 2025-11-17
Symbol: TSLA
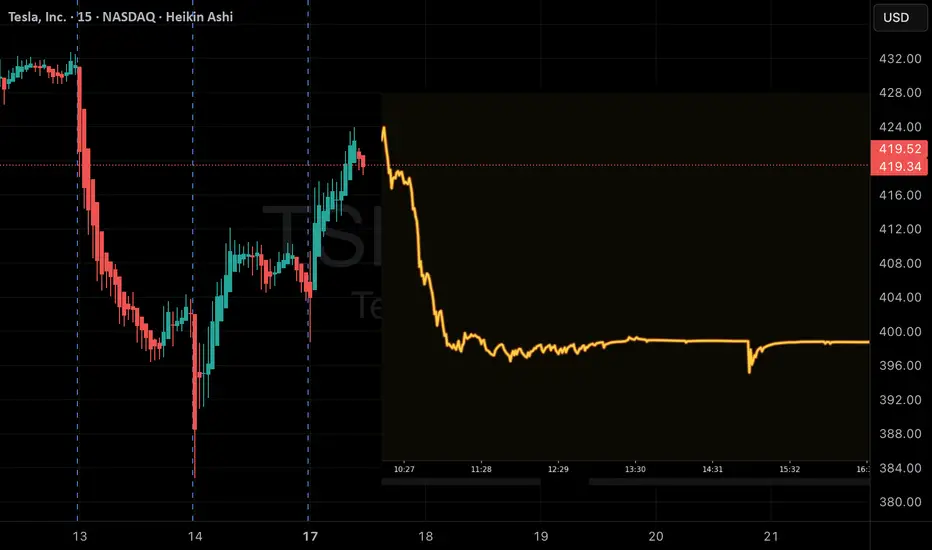
Price: 415.30
Model: Katy AI — 1M Prediction
Trend: Bearish
Confidence: 75%
🔮 Vision Summary
TSLA shows a bearish short-term structure, with the model forecasting a move toward 403.52
(-2.84%). Momentum is shifting lower, and volatility remains moderate at 20%, supporting a gradual downside drift rather than a sharp drop.
Near-term projection points to 411.47 within the next 30 minutes as price weakens into lower support zones.
📉 Key Levels
Entry Zone: 415.30
Downside Target: 405.87 – 403.52
Resistance / Invalidation: 421.53
🧭 Vision Bias
Bearish — Model anticipates sustained downside pressure as TSLA fails to reclaim short-term resistance.
Break above 421.53 invalidates the bearish thesis.
Symbol: TSLA
Price: 415.30
Model: Katy AI — 1M Prediction
Trend: Bearish
Confidence: 75%
🔮 Vision Summary
TSLA shows a bearish short-term structure, with the model forecasting a move toward 403.52
(-2.84%). Momentum is shifting lower, and volatility remains moderate at 20%, supporting a gradual downside drift rather than a sharp drop.
Near-term projection points to 411.47 within the next 30 minutes as price weakens into lower support zones.
📉 Key Levels
Entry Zone: 415.30
Downside Target: 405.87 – 403.52
Resistance / Invalidation: 421.53
🧭 Vision Bias
Bearish — Model anticipates sustained downside pressure as TSLA fails to reclaim short-term resistance.
Break above 421.53 invalidates the bearish thesis.
Free Signals Based on Latest AI models💰: QuantSignals.xyz
כתב ויתור
המידע והפרסומים אינם מיועדים להיות, ואינם מהווים, ייעוץ או המלצה פיננסית, השקעתית, מסחרית או מכל סוג אחר המסופקת או מאושרת על ידי TradingView. קרא עוד ב־תנאי השימוש.
Free Signals Based on Latest AI models💰: QuantSignals.xyz
כתב ויתור
המידע והפרסומים אינם מיועדים להיות, ואינם מהווים, ייעוץ או המלצה פיננסית, השקעתית, מסחרית או מכל סוג אחר המסופקת או מאושרת על ידי TradingView. קרא עוד ב־תנאי השימוש.