TSM Weekly Chart Analysis – Momentum Shift in Play
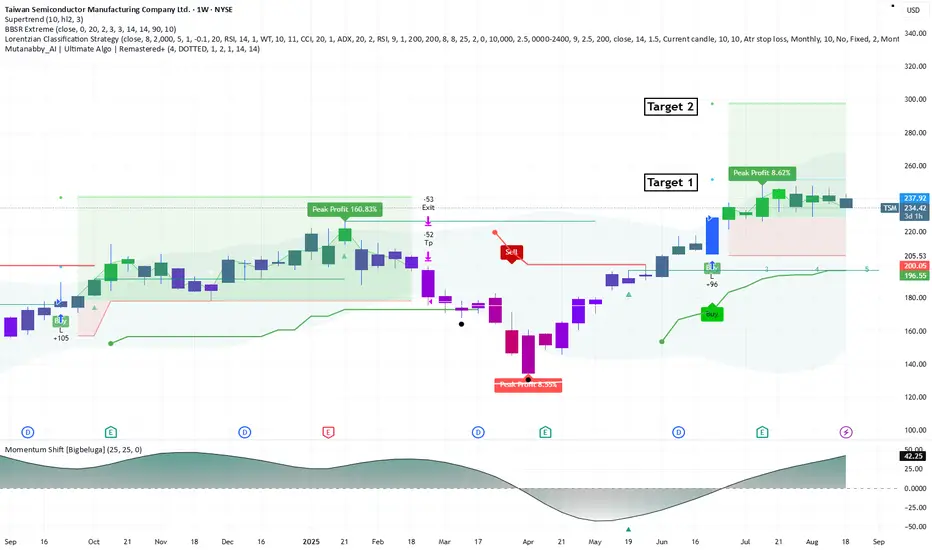
Taiwan Semiconductor (TSM) is showing signs of a major momentum shift on the weekly chart. Using a combination of MutantBuy.AI, Ultimate Algo, and BBR Extreme Close, we’ve identified key zones of support and resistance, along with potential buy/sell signals and profit targets.
Key Highlights:
Momentum Shift detected via [bigalgo] – signaling a possible trend reversal.
Uncertain Classification Std. suggests volatility ahead – ideal for strategic entries.
Support and Resistance zones mapped across 1D and 2W timeframes.
Algorithmic signals from MutantBuy.AI point to bullish potential.
Trade Setup:
Target 1: 272.00
Target 2: 300.00
Stop Loss: 198.95
Follow me for more AI-powered insights and weekly chart breakdowns.
Like and follow if you want to stay ahead of the curve with smart trading strategies.
כתב ויתור
המידע והפרסומים אינם מיועדים להיות, ואינם מהווים, ייעוץ או המלצה פיננסית, השקעתית, מסחרית או מכל סוג אחר המסופקת או מאושרת על ידי TradingView. קרא עוד ב־תנאי השימוש.
כתב ויתור
המידע והפרסומים אינם מיועדים להיות, ואינם מהווים, ייעוץ או המלצה פיננסית, השקעתית, מסחרית או מכל סוג אחר המסופקת או מאושרת על ידי TradingView. קרא עוד ב־תנאי השימוש.