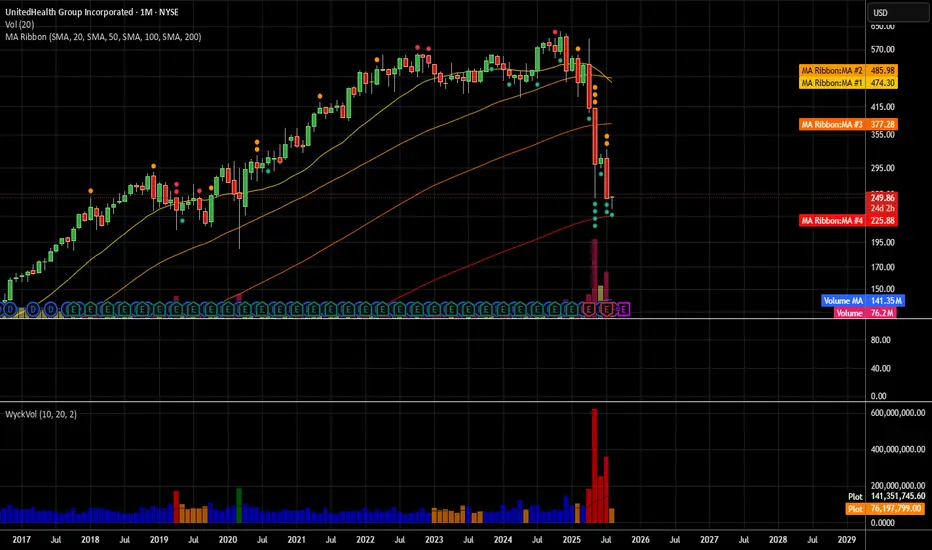
The price is currently around $250.51, rebounding after a steep drop.
There’s strong volume spike on the recent candles, suggesting capitulation selling and potential reversal.
The price is sitting near the SMA 200 on the monthly chart which historically acts as major long-term support.
Overhead resistance MAs: SMA/EMA 20/50 around $267–$280.
📈 Bullish Target Zones
First target (T1): $267 – near the 20/50 EMA/SMA cluster, where initial resistance is likely.
Second target (T2): $280–$285 – prior consolidation zone before breakdown.
Stretch target (T3): $300 – 310 retest of breakdown highs.
כתב ויתור
המידע והפרסומים אינם אמורים להיות, ואינם מהווים, עצות פיננסיות, השקעות, מסחר או סוגים אחרים של עצות או המלצות שסופקו או מאושרים על ידי TradingView. קרא עוד בתנאים וההגבלות.
כתב ויתור
המידע והפרסומים אינם אמורים להיות, ואינם מהווים, עצות פיננסיות, השקעות, מסחר או סוגים אחרים של עצות או המלצות שסופקו או מאושרים על ידי TradingView. קרא עוד בתנאים וההגבלות.