🔎 1. Chart Pattern
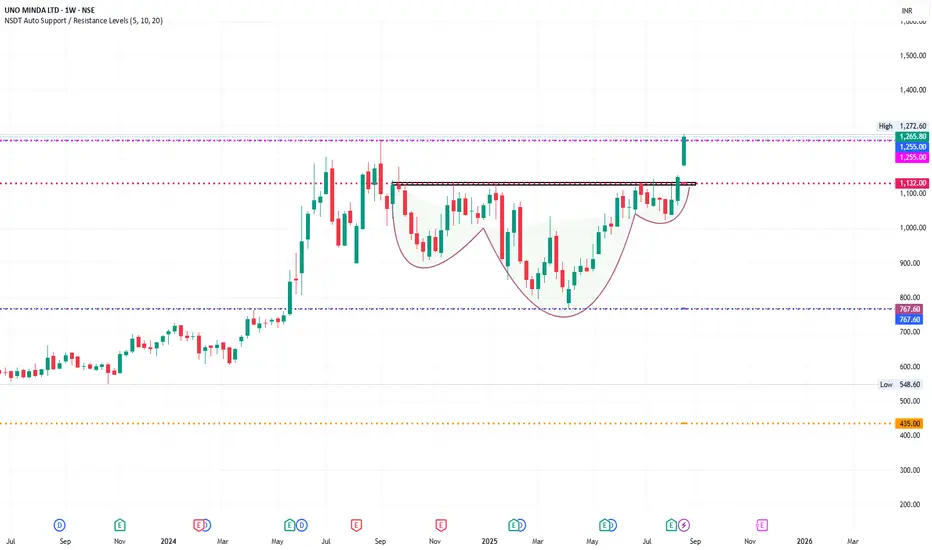
The chart is clearly showing a Cup and Handle Pattern (highlighted).
Breakout has happened above the neckline (~₹1130–1140) with strong bullish candle.
Cup & Handle is a continuation pattern – breakout targets can be measured.
📌 Target Calculation:
Depth of the cup = 1132 (neckline) – 767 (bottom) ≈ 365 points.
Breakout above 1132 → Target = 1132 + 365 = ₹1495 approx.
Short-term resistance: ₹1270–1280 (already touched).
Next zone: ₹1350 → ₹1450 → ₹1500.
🔎 2. Support & Resistance
Immediate Support: ₹1130–1150 (previous neckline).
Strong Support Zone: ₹1050–1070 (previous consolidation).
Major Support: ₹767 (cup bottom).
Immediate Resistance: ₹1270–1280 (tested).
Major Resistance Levels: ₹1350, then ₹1495.
🔎 3. Candlestick / Price Action
Current weekly candle is long green, wide-range, high volume breakout → very bullish.
Closing above ₹1250 is confirmation of breakout.
🔎 4. Indicators (if applied)
RSI (Relative Strength Index): Likely crossing above 65–70 → shows momentum but not yet extreme overbought (healthy breakout).
MACD: Likely bullish crossover with histogram expansion.
Volume: Breakout candle with strong volume confirms institutional buying.
Moving Averages:
Price is above 20W, 50W, 200W EMAs → strong uptrend.
Golden cross already confirmed earlier.
🔎 5. Trend Outlook
Primary Trend (1–2 years): Strong Bullish.
Intermediate Trend (2–6 months): Bullish continuation towards ₹1450–1500.
Short Term (1–4 weeks): May retest ₹1180–1200 before further rally.
📌 Conclusion (Expert View)
✅ Stock has given a Cup & Handle breakout above ₹1130 with strong momentum.
✅ Upside targets: ₹1350 → ₹1450 → ₹1500.
✅ Downside support: ₹1130, then ₹1050.
⚠️ Near-term, RSI may cool off → watch for pullback to ₹1180–1200 as entry opportunity.
👉 Strategy:
Swing Traders: Buy on dips near ₹1180–1200 with SL below ₹1050.
Investors: Can hold for long-term with next target ₹1500+.
This is only for educational pattern not for sugesstion.
כתב ויתור
המידע והפרסומים אינם אמורים להיות, ואינם מהווים, עצות פיננסיות, השקעות, מסחר או סוגים אחרים של עצות או המלצות שסופקו או מאושרים על ידי TradingView. קרא עוד בתנאים וההגבלות.
כתב ויתור
המידע והפרסומים אינם אמורים להיות, ואינם מהווים, עצות פיננסיות, השקעות, מסחר או סוגים אחרים של עצות או המלצות שסופקו או מאושרים על ידי TradingView. קרא עוד בתנאים וההגבלות.