The trendline I drew yesterday played out perfectly. After the Bearish FVG + rejection, the trend broke and a second Bearish FVG formed right after.
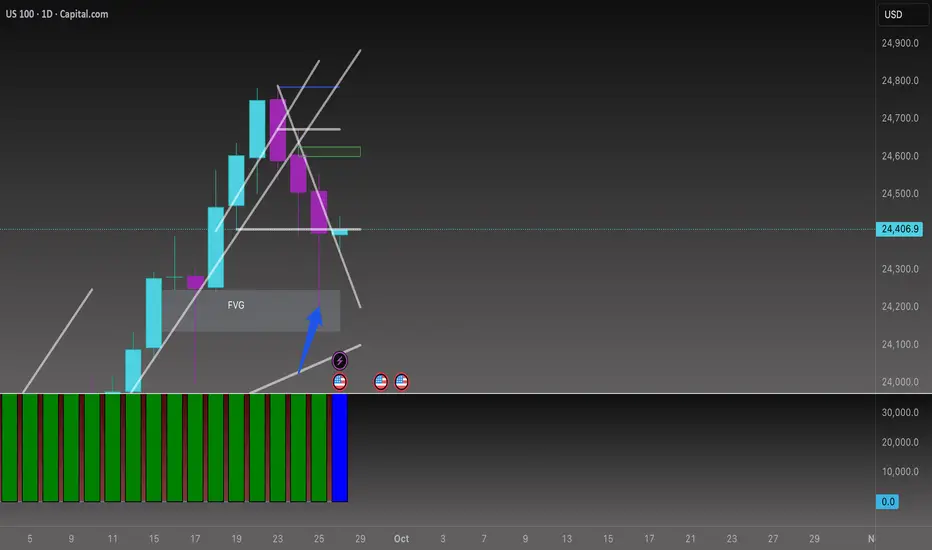
NASDAQ Daily Analysis 📊
On the daily chart, the FVG formed on Sep 15th has been revisited, but price couldn’t hold in this zone and was quickly rejected. The trendline I’ve drawn is still active and guiding the move.
👉 If a bullish candle forms above the trend, I’ll be looking at 24,543 as a buy point.
👉 If sellers take control and push price below the trend, we could see a move down toward the FVG region at 24,340.
⚡Bottom line:
• If Core PCE cools off → bullish continuation fits.
• If Core PCE runs hot → expect sellers to take control.
כתב ויתור
The information and publications are not meant to be, and do not constitute, financial, investment, trading, or other types of advice or recommendations supplied or endorsed by TradingView. Read more in the Terms of Use.
כתב ויתור
The information and publications are not meant to be, and do not constitute, financial, investment, trading, or other types of advice or recommendations supplied or endorsed by TradingView. Read more in the Terms of Use.