שורט
US 100 (A BEARISH PATTERN)
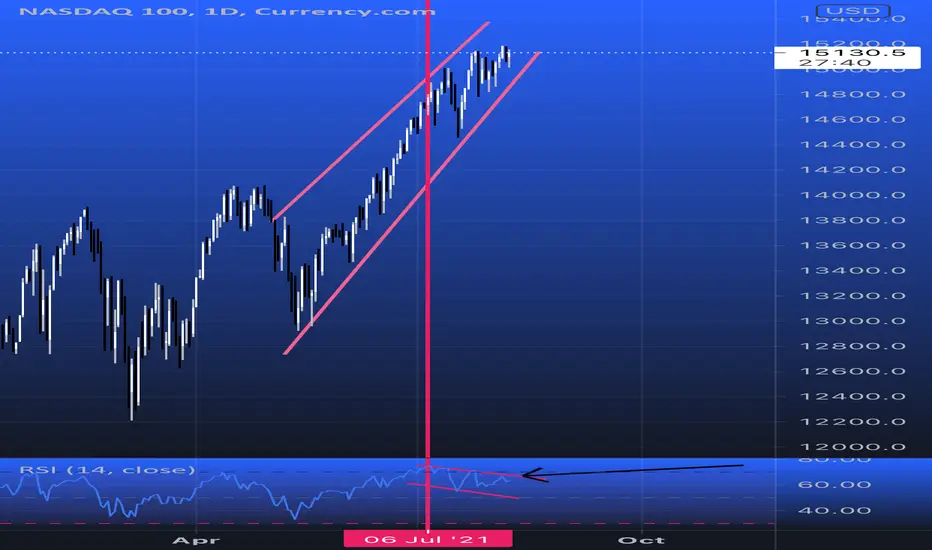
Here we can see clearly the US Index seems to have formed a double top (M), a bearish pattern, on the daily time frame. The RSI indicator is also showing us a Divergence down trend from the actual chart + it’s also near the overbought territory.
Keep an eye on the US INDEX over coming days or week. Happy pip hunting traders.
Keep an eye on the US INDEX over coming days or week. Happy pip hunting traders.
פרסומים קשורים
כתב ויתור
המידע והפרסומים אינם אמורים להיות, ואינם מהווים, עצות פיננסיות, השקעות, מסחר או סוגים אחרים של עצות או המלצות שסופקו או מאושרים על ידי TradingView. קרא עוד בתנאים וההגבלות.
פרסומים קשורים
כתב ויתור
המידע והפרסומים אינם אמורים להיות, ואינם מהווים, עצות פיננסיות, השקעות, מסחר או סוגים אחרים של עצות או המלצות שסופקו או מאושרים על ידי TradingView. קרא עוד בתנאים וההגבלות.