DOW JONES rejection finding Support soon.
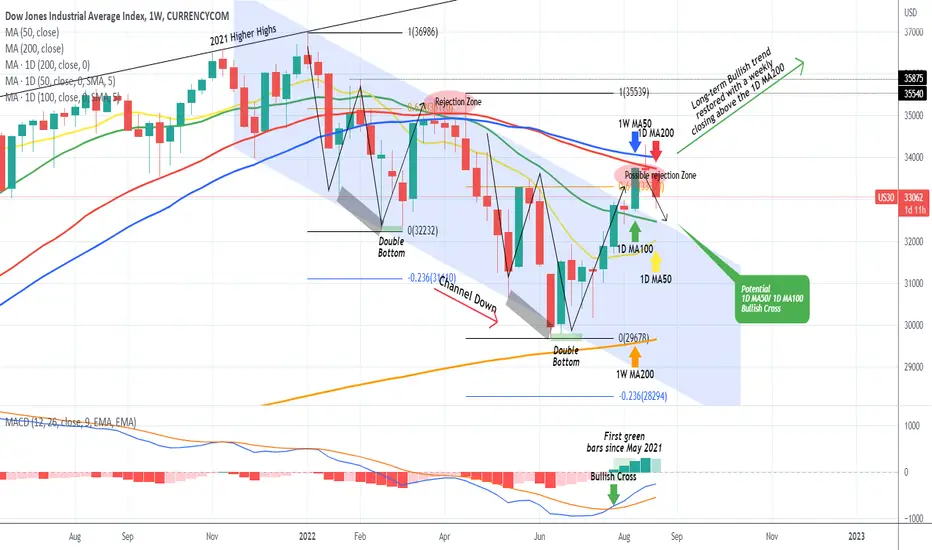
Exactly 2 weeks ago on our last Dow Jones (DJI) analysis we stated that the price had entered a possible rejection zone (red) and unless it closed a weekly (1W) candle above the 1D MA200, we would get a pull-back:

Well as it turned out the index closed last week below both the 1D MA200 (red trend-line) and the 1W MA50 (blue trend-line), which are very close to each other, and got a considerable rejection this week. The price is now approaching the critical Support cluster that consists of the 1D MA100 (green trend-line) and the 1D MA50 (yellow trend-line). The chances of getting a new bounce are high as not only are wee on a 1W MACD Bullish Cross since late July but also the 1D MA50 is about to cross above the 1D MA100, forming a Bullish Cross. Last time that happened was on after the June 15 2020 1W candle, which was the first recovery from the March 2020 COVID crash:

As you see, the 1D MA50 and 1D MA100 held as Support levels and Dow was able to sustain a solid rise. Technically there is no reason not to expect a similar development but in order to technically claim that the index is back onto the long-term bullish trend we need to see a weekly candle closing above the 1D MA200.
--------------------------------------------------------------------------------------------------------
** Please support this idea with your likes and comments, it is the best way to keep it relevant and support me. **
--------------------------------------------------------------------------------------------------------
Well as it turned out the index closed last week below both the 1D MA200 (red trend-line) and the 1W MA50 (blue trend-line), which are very close to each other, and got a considerable rejection this week. The price is now approaching the critical Support cluster that consists of the 1D MA100 (green trend-line) and the 1D MA50 (yellow trend-line). The chances of getting a new bounce are high as not only are wee on a 1W MACD Bullish Cross since late July but also the 1D MA50 is about to cross above the 1D MA100, forming a Bullish Cross. Last time that happened was on after the June 15 2020 1W candle, which was the first recovery from the March 2020 COVID crash:
As you see, the 1D MA50 and 1D MA100 held as Support levels and Dow was able to sustain a solid rise. Technically there is no reason not to expect a similar development but in order to technically claim that the index is back onto the long-term bullish trend we need to see a weekly candle closing above the 1D MA200.
--------------------------------------------------------------------------------------------------------
** Please support this idea with your likes and comments, it is the best way to keep it relevant and support me. **
--------------------------------------------------------------------------------------------------------
👑Best Signals (Forex/Crypto+70% accuracy) & Account Management (+20% profit/month on 10k accounts)
💰Free Channel t.me/tradingshotglobal
🤵Contact info@tradingshot.com t.me/tradingshot
🔥New service: next X100 crypto GEMS!
💰Free Channel t.me/tradingshotglobal
🤵Contact info@tradingshot.com t.me/tradingshot
🔥New service: next X100 crypto GEMS!
כתב ויתור
המידע והפרסומים אינם מיועדים להיות, ואינם מהווים, ייעוץ או המלצה פיננסית, השקעתית, מסחרית או מכל סוג אחר המסופקת או מאושרת על ידי TradingView. קרא עוד ב־תנאי השימוש.