📍 US30 Technical Breakdown – 11/24/2025
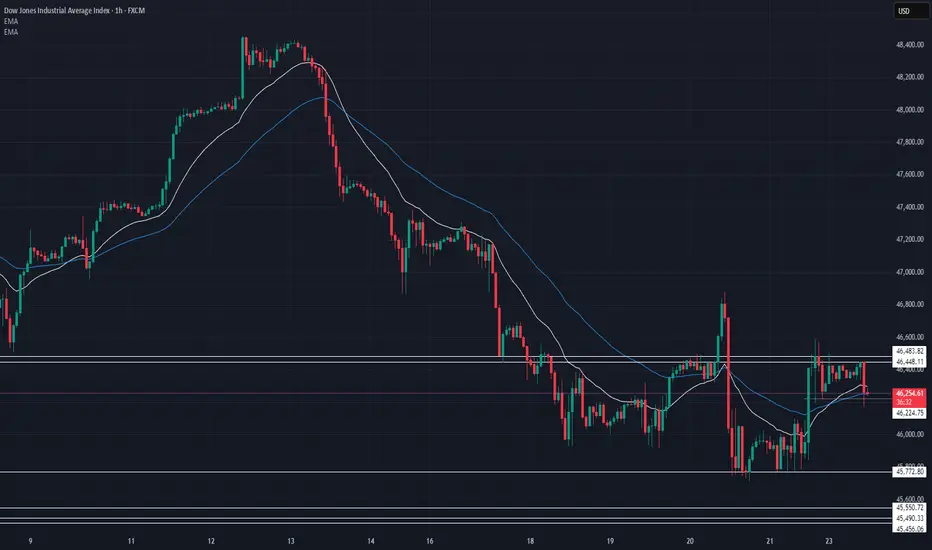
US30 showing signs of early recovery after last week’s heavy selloff, but still struggling to break above the 46,450–46,500 intraday resistance zone. Price remains below key EMAs, meaning sellers still hold the structural advantage unless bulls reclaim higher levels 🔎📉
After tapping demand around 45,770–45,900, buyers stepped in, but momentum is weak as long as the index stays under the 46,500 ceiling.
📊 Market Behavior:
🔹 Price rejecting 46,450–46,500 repeatedly → strong short-term supply
🔹 EMAs still sloping bearish → momentum favors sellers
🔹 Range-style behavior forming between 46,000–46,500
🔹 Bulls need a clean reclaim above EMAs for trend shift
📌 Key Levels:
Resistance:
🔹 46,450–46,500 → major intraday ceiling
🔹 46,780 → breakout extension
🔹 47,000 → structural shift zone
Support:
🔹 46,120 → weak intraday support
🔹 45,900 → key reaction zone
🔹 45,770 → major demand / bottom of range
🔹 45,456 – 45,320 → higher-timeframe demand
🧠 Bias:
Overall structure still bearish unless 46,500 breaks
📉 Sellers hold control beneath EMAs
⬆️ Break & close above 46,500 → opens move toward 46,780–47,000
⬇️ Rejection at 46,500 + break back under 46,120 → signals continuation lower
כתב ויתור
המידע והפרסומים אינם מיועדים להיות, ואינם מהווים, ייעוץ או המלצה פיננסית, השקעתית, מסחרית או מכל סוג אחר המסופקת או מאושרת על ידי TradingView. קרא עוד ב־תנאי השימוש.
כתב ויתור
המידע והפרסומים אינם מיועדים להיות, ואינם מהווים, ייעוץ או המלצה פיננסית, השקעתית, מסחרית או מכל סוג אחר המסופקת או מאושרת על ידי TradingView. קרא עוד ב־תנאי השימוש.