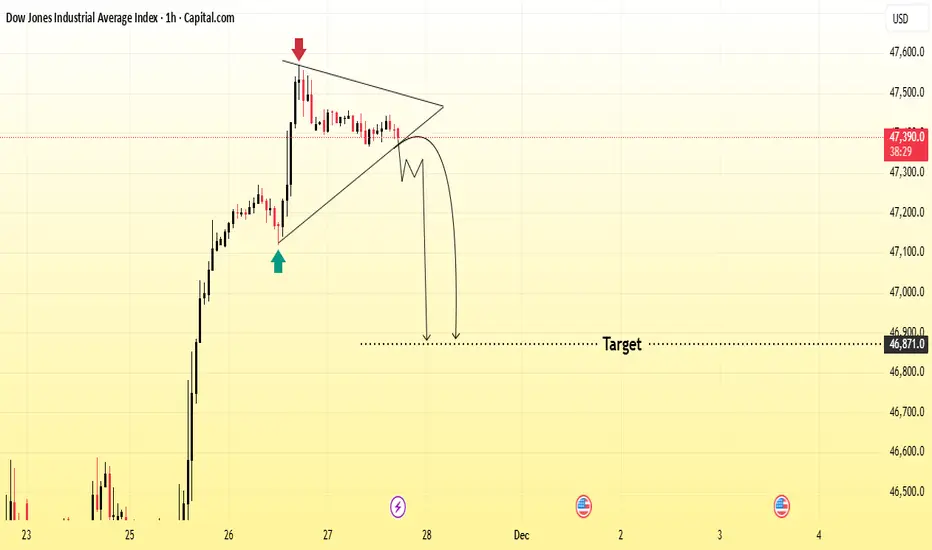
Price is forming a symmetrical triangle after a strong bullish move. The chart shows rejection from the top (red arrow) and a possible breakdown from the triangle pattern.
If price breaks below the lower trendline, it may drop toward the marked target zone around 46,800–46,600.
Bias: Bearish below triangle
Confirmation: Clean breakout + retest
Target: 46,800 area
If price breaks below the lower trendline, it may drop toward the marked target zone around 46,800–46,600.
Bias: Bearish below triangle
Confirmation: Clean breakout + retest
Target: 46,800 area
Join My Telegram Channel
t.me/EliteGoldAnalysis34
Join My Vip Memebership
t.me/+hRsF7h9mMBE2NWJk
t.me/EliteGoldAnalysis34
Join My Vip Memebership
t.me/+hRsF7h9mMBE2NWJk
כתב ויתור
המידע והפרסומים אינם מיועדים להיות, ואינם מהווים, ייעוץ או המלצה פיננסית, השקעתית, מסחרית או מכל סוג אחר המסופקת או מאושרת על ידי TradingView. קרא עוד ב־תנאי השימוש.