📊 US500 Weekly Chart Analysis
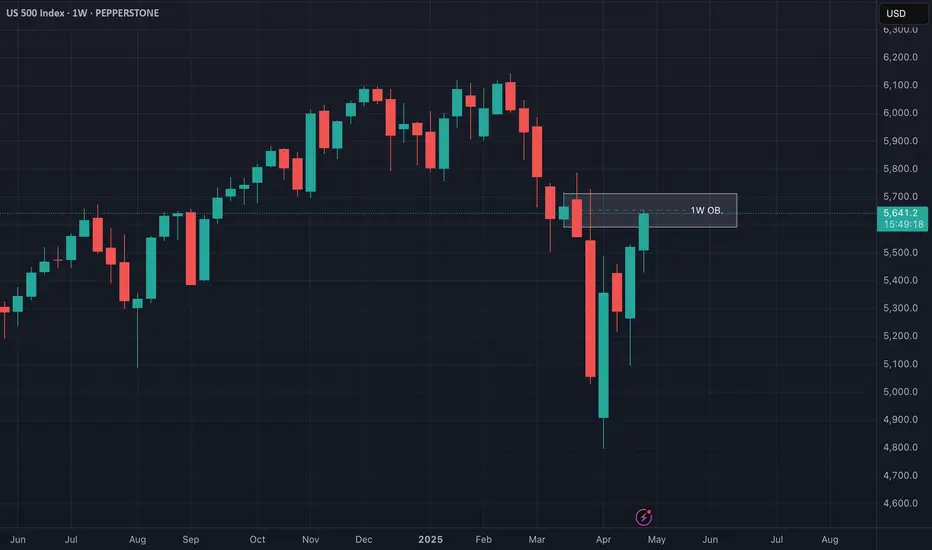
Taking a close look at the US500 on the weekly timeframe, we can see price has now traded directly into a bearish weekly order block 🧱 — a key distribution zone where smart money activity often emerges. At this level, the market is trading at a premium 💰 and appears to be overextended 📈.
⚠️ From a risk management standpoint, I’d advise extreme caution — the current conditions could set the stage for a sharp retracement, especially as we approach week’s end. This level aligns with areas where institutional players may look to offload risk or reverse exposure.
🔁 A potential pullback from here would not be surprising, given the elevated context and technical structure.
📚 This breakdown is for educational purposes only and should not be considered financial advice.
🚀 Winning Scalping Strategy To Beat Market Chaos: ✅ 🚀
👀 🔗 youtu.be/4aI23mzOLJE
🚀 Trade Signals For Your PROP FIRM CHALLENGE: 🔥💰
👀 🔗 youtu.be/nWD69sSxRUM
👉Join Our Free DISCORD:
🔗 discord.com/invite/PcBeCdwVQq
👀 🔗 youtu.be/4aI23mzOLJE
🚀 Trade Signals For Your PROP FIRM CHALLENGE: 🔥💰
👀 🔗 youtu.be/nWD69sSxRUM
👉Join Our Free DISCORD:
🔗 discord.com/invite/PcBeCdwVQq
כתב ויתור
המידע והפרסומים אינם אמורים להיות, ואינם מהווים, עצות פיננסיות, השקעות, מסחר או סוגים אחרים של עצות או המלצות שסופקו או מאושרים על ידי TradingView. קרא עוד בתנאים וההגבלות.