Macro Dashboard: Growth, Inflation, and Market Sentiment
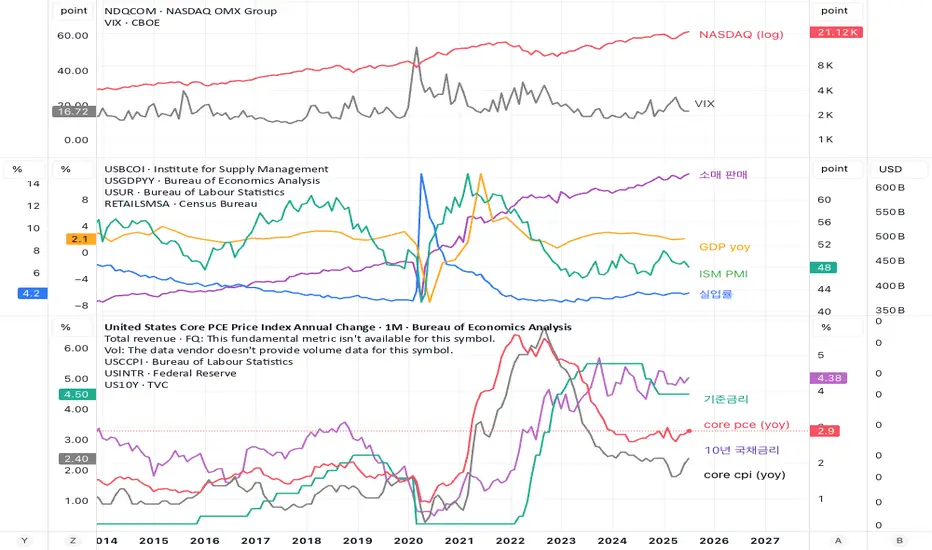
This set of three charts provides a concise overview of the U.S. macroeconomic landscape, grouped into three key categories:
Market Sentiment
NASDAQ, VIX
Captures risk appetite and volatility in equity markets. NASDAQ reflects growth and tech-sector momentum, while VIX indicates fear and uncertainty.
Economic Activity
Retail Sales, GDP YoY, ISM PMI, Unemployment Rate
Tracks the pulse of the real economy. Retail sales and ISM PMI show consumer and business activity, GDP YoY highlights overall growth, and unemployment measures labor market strength.
Monetary Policy & Inflation
Fed Funds Rate, Core PCE YoY, Core CPI YoY, 10Y Treasury Yield
Monitors the Federal Reserve’s policy stance and inflation dynamics. Core PCE and Core CPI are key inflation measures, while the 10-year yield reflects market expectations for growth and policy.
Together, these charts help visualize how economic fundamentals, inflation, and market sentiment interact — a practical dashboard for understanding U.S. macro conditions and their impact on financial markets.
כתב ויתור
המידע והפרסומים אינם מיועדים להיות, ואינם מהווים, ייעוץ או המלצה פיננסית, השקעתית, מסחרית או מכל סוג אחר המסופקת או מאושרת על ידי TradingView. קרא עוד ב־תנאי השימוש.
כתב ויתור
המידע והפרסומים אינם מיועדים להיות, ואינם מהווים, ייעוץ או המלצה פיננסית, השקעתית, מסחרית או מכל סוג אחר המסופקת או מאושרת על ידי TradingView. קרא עוד ב־תנאי השימוש.