analysis of the USD/CAD 2-hour chart you provided:
Technical Breakdown:
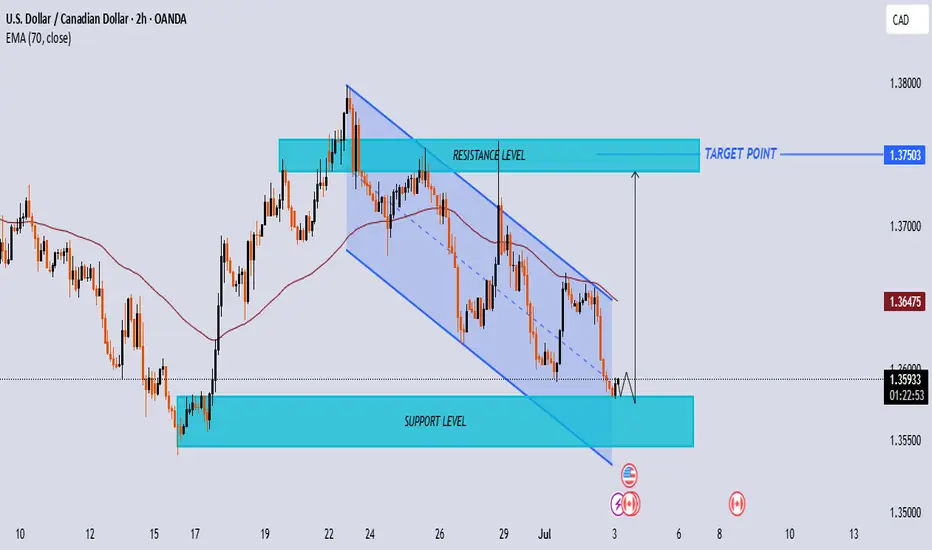
📉 Downtrend Channel (Falling Wedge)
Price is moving within a descending channel structure (marked with blue lines).
The market has been making lower highs and lower lows, typical of a bearish trend.
Key Levels:
✅ Support Zone: Around 1.35500 - 1.35800
Price has reached this strong support zone.
Previous price reactions from this area suggest buying interest.
✅ Resistance Zone: Around 1.36800 - 1.37200
Identified as the next major obstacle for bullish movement.
✅ Target Point: 1.37503
Marked as the final potential bullish target if price breaks above resistance.
Indicators:
70 EMA (Exponential Moving Average) currently at 1.36475
Price is trading below the EMA, confirming the short-term bearish pressure.
A breakout above EMA may support bullish momentum.
Price Action Expectation:
⚡ Bullish Scenario:
If price holds at the support zone and breaks out of the descending channel:
Expect a reversal towards the resistance zone.
If that breaks, price may target 1.37503, completing a potential bullish reversal pattern.
⚠️ Bearish Scenario:
If price fails to hold the support zone:
A breakdown below 1.35500 could trigger further downside.
Next significant support likely around 1.35000.
Summary:
Market is at a key decision zone.
Watching for:
Rejection and breakout above the falling wedge → Bullish opportunity.
Breakdown below support → Bearish continuation.
Technical Breakdown:
📉 Downtrend Channel (Falling Wedge)
Price is moving within a descending channel structure (marked with blue lines).
The market has been making lower highs and lower lows, typical of a bearish trend.
Key Levels:
✅ Support Zone: Around 1.35500 - 1.35800
Price has reached this strong support zone.
Previous price reactions from this area suggest buying interest.
✅ Resistance Zone: Around 1.36800 - 1.37200
Identified as the next major obstacle for bullish movement.
✅ Target Point: 1.37503
Marked as the final potential bullish target if price breaks above resistance.
Indicators:
70 EMA (Exponential Moving Average) currently at 1.36475
Price is trading below the EMA, confirming the short-term bearish pressure.
A breakout above EMA may support bullish momentum.
Price Action Expectation:
⚡ Bullish Scenario:
If price holds at the support zone and breaks out of the descending channel:
Expect a reversal towards the resistance zone.
If that breaks, price may target 1.37503, completing a potential bullish reversal pattern.
⚠️ Bearish Scenario:
If price fails to hold the support zone:
A breakdown below 1.35500 could trigger further downside.
Next significant support likely around 1.35000.
Summary:
Market is at a key decision zone.
Watching for:
Rejection and breakout above the falling wedge → Bullish opportunity.
Breakdown below support → Bearish continuation.
join my tellegram channel
t.me/+yhY0QtYtM0g0NWM0
join my refferal broker
one.exnesstrack.org/a/g565sj1uo7?source=app
t.me/+yhY0QtYtM0g0NWM0
join my refferal broker
one.exnesstrack.org/a/g565sj1uo7?source=app
כתב ויתור
המידע והפרסומים אינם אמורים להיות, ואינם מהווים, עצות פיננסיות, השקעות, מסחר או סוגים אחרים של עצות או המלצות שסופקו או מאושרים על ידי TradingView. קרא עוד בתנאים וההגבלות.