Trading Idea:
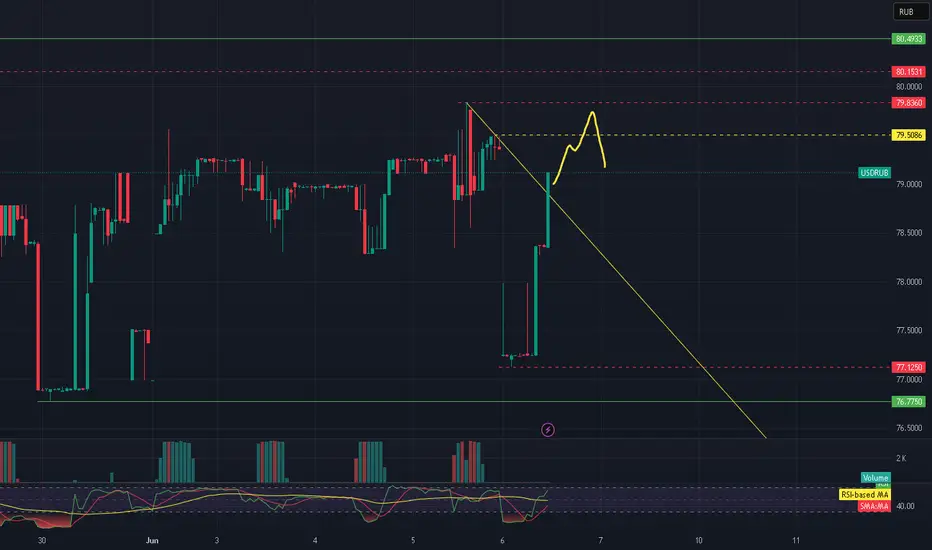
Short from 79,50-79,80!
Support & resistance:
🔴 Resistance Levels:
79.8360 — the nearest key resistance level, previously acted as a pullback and profit-taking zone.
80.1531 — strong resistance from which the last downward impulse originated.
80.4933 — the upper boundary of the range; serves as a potential target if the price breaks higher.
🟡 Support Levels:
79.5086 — local support level, where price may consolidate after breaking the descending trendline.
77.1250 — a confirmed level where downward momentum previously halted.
76.7750 — important support zone from which the current bullish impulse started.
🔍 Additional Notes:
Price has confidently broken above the descending trendline and is testing the 79.50 level — a potential setup for consolidation and continuation upward.
RSI has exited the oversold zone, confirming bullish momentum.
Volume increased on the upward impulse, supporting the probability of further upward movement.
כתב ויתור
המידע והפרסומים אינם מיועדים להיות, ואינם מהווים, ייעוץ או המלצה פיננסית, השקעתית, מסחרית או מכל סוג אחר המסופקת או מאושרת על ידי TradingView. קרא עוד ב־תנאי השימוש.
כתב ויתור
המידע והפרסומים אינם מיועדים להיות, ואינם מהווים, ייעוץ או המלצה פיננסית, השקעתית, מסחרית או מכל סוג אחר המסופקת או מאושרת על ידי TradingView. קרא עוד ב־תנאי השימוש.