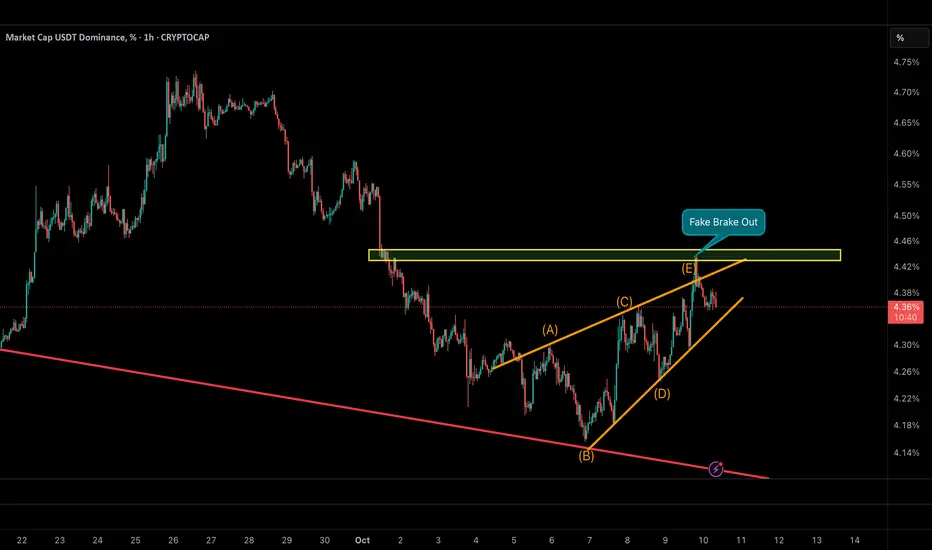
USDT Dominance has completed a contracting wedge pattern (A–B–C–D–E), followed by a fake breakout above the key resistance zone near 4.45%.
This move likely trapped late buyers of USDT at liquidity highs.
As long as dominance remains below 4.35%, the probability of a deeper decline toward 4.15–4.20% increases —
which could mark the beginning of capital rotation into altcoins.
In contrast, a confirmed breakout above 4.46% would invalidate this setup and suggest a new sideways phase.
📉 Base Scenario: Continuation of decline toward 4.15–4.20%
🚀 Implication: Growing probability of an upcoming Altseason
📊 CryptoPilot – Advanced Technical Analysis for BTC & Altcoins
🔎 Smart Money • Price Action • NeoWave • Multi-Timeframe Context
📩 Contact: @CryptoPilot_1 (Telegram)
📥 Telegram Chanell : @CryptoPilot_Trading
🔎 Smart Money • Price Action • NeoWave • Multi-Timeframe Context
📩 Contact: @CryptoPilot_1 (Telegram)
📥 Telegram Chanell : @CryptoPilot_Trading
פרסומים קשורים
כתב ויתור
המידע והפרסומים אינם מיועדים להיות, ואינם מהווים, ייעוץ או המלצה פיננסית, השקעתית, מסחרית או מכל סוג אחר המסופקת או מאושרת על ידי TradingView. קרא עוד ב־תנאי השימוש.