USDT Dominance Chart Update.
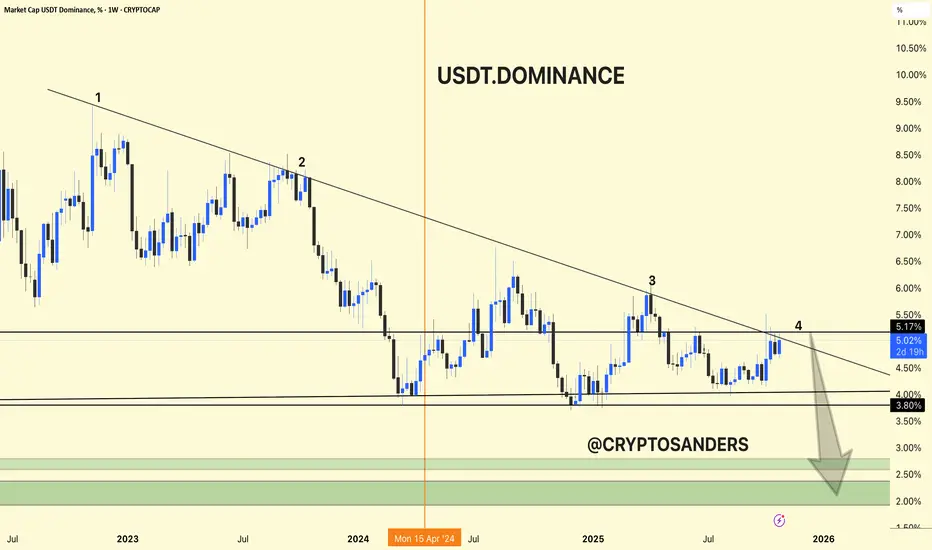
USDT dominance is again rejecting at the long-term trendline resistance (point 4), currently around 5.17%.
Structure suggests another potential move lower, with possible targets in the green zone (2.0%–3.0%) if the downtrend continues.
This scenario typically favors fresh capital rotation into Bitcoin and altcoins as traders de-risk from stablecoins.
Summary:
USDT dominance remains weak below the trendline. A sustained drop could spark further altcoin momentum and a broader crypto rally.
פרסומים קשורים
כתב ויתור
המידע והפרסומים אינם אמורים להיות, ואינם מהווים, עצות פיננסיות, השקעות, מסחר או סוגים אחרים של עצות או המלצות שסופקו או מאושרים על ידי TradingView. קרא עוד בתנאים וההגבלות.
פרסומים קשורים
כתב ויתור
המידע והפרסומים אינם אמורים להיות, ואינם מהווים, עצות פיננסיות, השקעות, מסחר או סוגים אחרים של עצות או המלצות שסופקו או מאושרים על ידי TradingView. קרא עוד בתנאים וההגבלות.